GBP/USD Price Analysis: Bears seeking a break of critical support
- The price is stuck below the hourly chart's resistance near 1.2550.
- If the bears break the support of 1.2430 then there is a price imbalance to 1.2390 and then 1.2330.
GBP/USD is making tracks to the downside and the bears will be seeking a continuation of the weekly chart as illustrated below. However, the price is trapped between daily resistance and support structure as the following shows.
GBP/USD weekly chart

The price has made a 50% mean reversion on the weekly chart and the bears are moving in again. This could be the last stop before a downside continuation for the weeks ahead.
GBP/USD daily chart
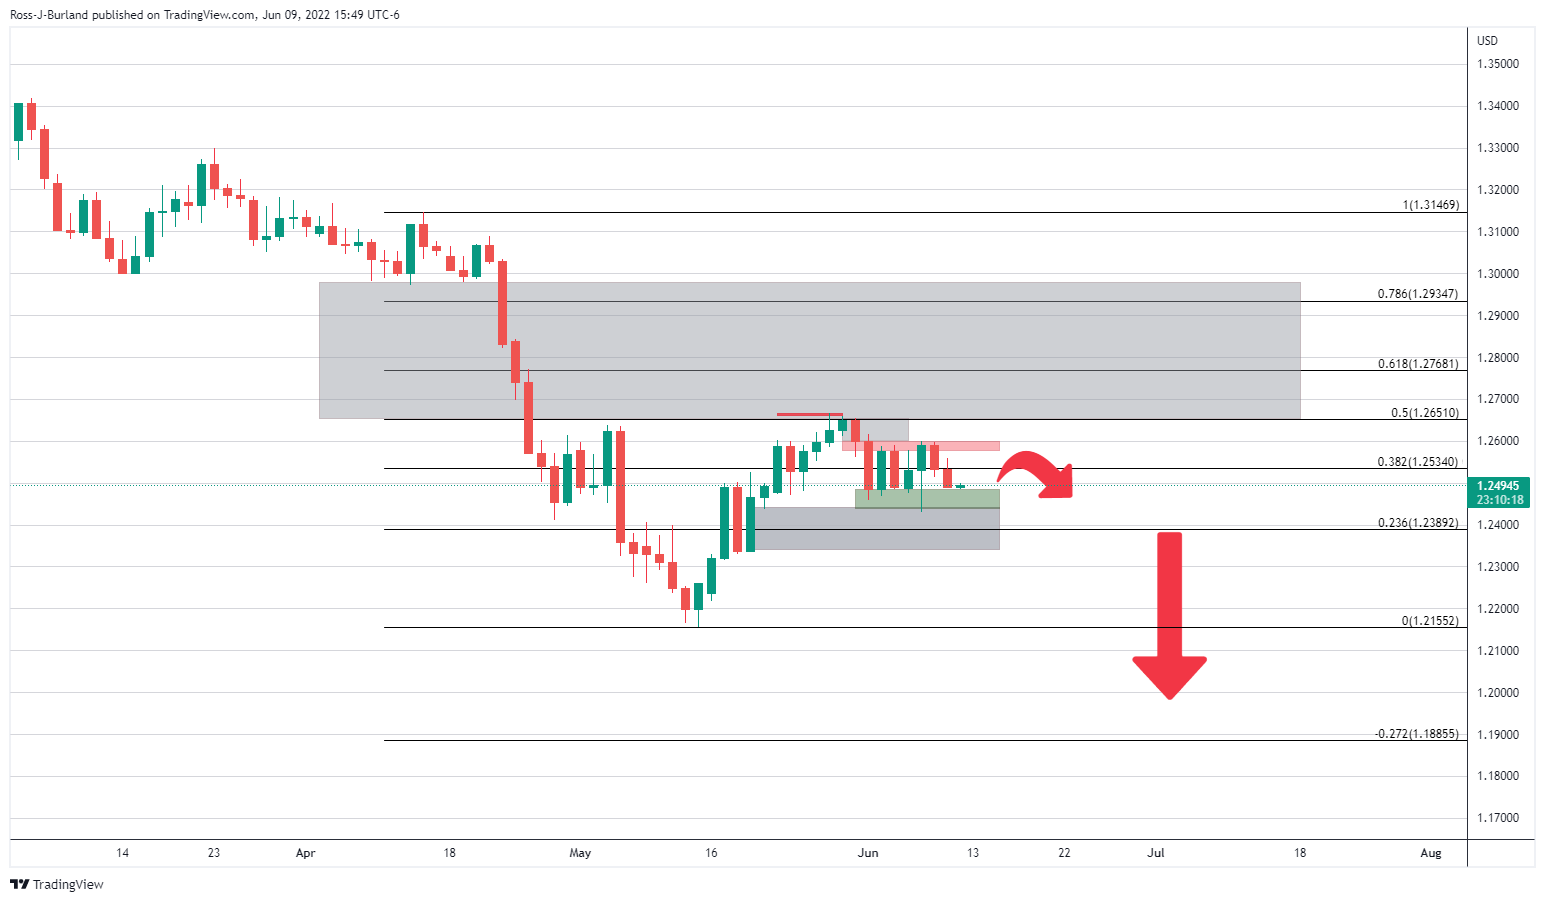
On the daily chart, however, the price is trapped between resistance and support. A break either way will open the risk of a price imbalance mitigation for the days ahead.
GBP/USD H1 chart
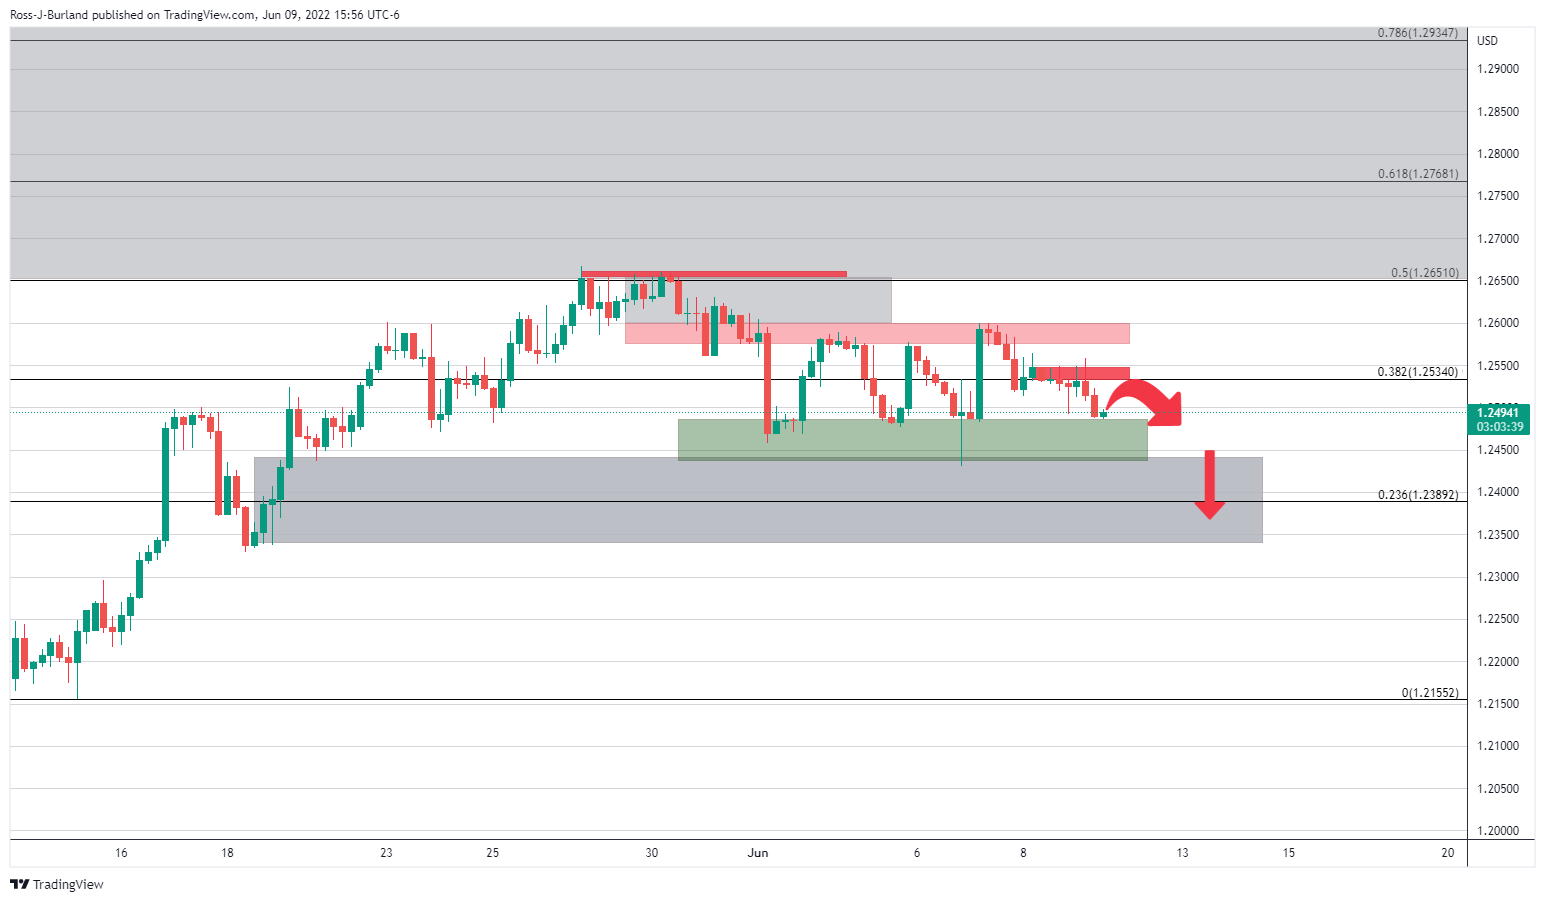
The price will now need to hold below the hourly chart's resistance near 1.2550. If the bears break the support of 1.2430 then there is a price imbalance to 1.2390 and then 1.2330.