USD/CAD Price Analysis: 20-day EMA guards immediate upside amid sluggish momentum
- USD/CAD consolidates recent losses around short-term key resistance.
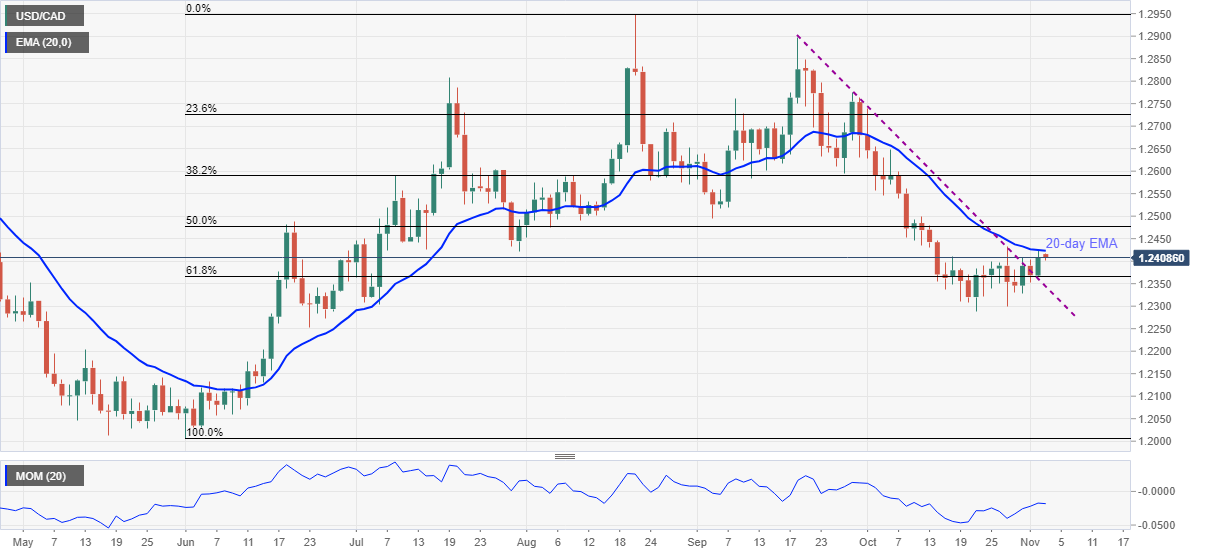
- Sustained trading beyond 61.8% Fibonacci retracement, six-week-old trend line resistance test bears.
- September’s low adds to the upside filters before convincing buyers.
USD/CAD seesaws near 1.2410, grinds higher following the biggest daily jump in two weeks. In doing so, the Loonie pair battles 20-day EMA to extend the previous day’s run-up during Wednesday’s Asian session amid a sluggish Momentum line.
That said, successful trading beyond 61.8% Fibonacci retracement (Fibo.) and the pair’s ability to keep the early-week break of a descending resistance line from September 20, now resistance, favor USD/CAD buyers.
It’s worth noting that September’s low of 1.2493 acts as an additional resistance beyond the immediate 20-day EMA hurdle of 1.2423.
Should the quote manage to stay firmer past 1.2493, also cross the 1.2500 threshold, USD/CAD bulls may aim for 38.2% Fibonacci retracement of June-August upside, near 1.2590.
On the flip side, the 61.8% Fibo. level surrounding 1.2365 preceded the resistance-turned-support line near 1.2345, to restrict short-term declines of the USD/CAD prices.
Also challenging the pair bears is the 1.2300-2290 region, comprising the lows marked in July and October.
USD/CAD: Daily chart
Trend: Further recovery expected