Gold Price Forecast: XAU/USD looks south ahead of NFP, key levels to watch – Confluence Detector
- Firmer DXY, Treasury yields throw gold price under the bus.
- Pre-NFP caution keeps the bearish pressure intact on gold.
- Gold Weekly Forecast: Bulls hesitate as focus shift to NFP.
Gold is once again testing bullish commitments near $1800 levels, down for the second straight day, in anticipation of sooner-than-expected unwinding of the monetary policy support from the Fed. The Treasury yields have advanced on the Fed’s hawkish rhetoric, driving the US dollar to weekly tops alongside. Having said that, gold price remains on track for the worst weekly drop since mid-June. The breach of the long-held SMA100 one-day support at $1805 has provided that extra zest to gold sellers, as the focus now shifts towards the crucial US NFP release due at 1230 GMT.
The US labor market will set the tone for gold price in the coming weeks, as it will offer fresh cues on the Fed’s next policy move, especially after Vice Chair Richard Clarida said the central bank could start tapering bond-buying this year.
Read: US NFP to confirm death cross for gold? Downside remains favored
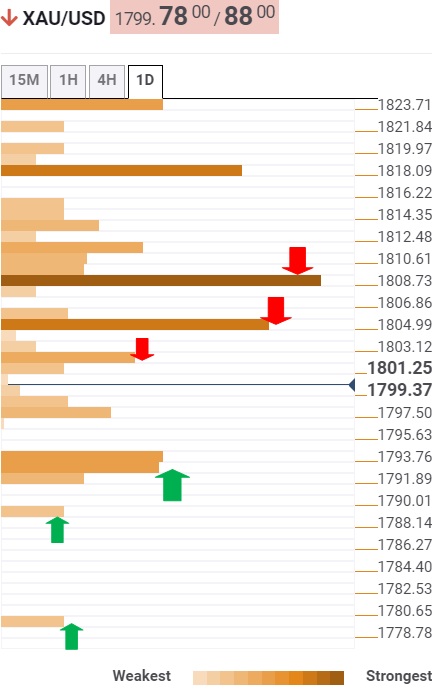
Gold Price: Key levels to watch
The Technical Confluences Detector shows that gold has tested the $1797 support area, which is the convergence of the pivot point one-day S1 and the previous day’s low.
A firm break below the latter is needed to expose the previous week’s low of $1793. The Fibonacci 61.8% one-month coincides at that level.
Further south, the pivot point one-day S2 at $1789 could get tested.
A sharp sell-off towards the pivot point one-day S3 at $1779 could be in the offing should the bulls fail to resist above the latter.
On the upside, immediate support is seen at $1803, the confluence of the previous high four-hour and Fibonacci 23.6% one-day.
The next relevant upside target is aligned at the intersection of the SMA100 one-day and Fibonacci 38.2% one-day at $1805.
Acceptance above the $1809 powerful hurdle is critical to staging any meaningful recovery in the near term.
At that point, the Fibonacci 61.8% one-day, Fibonacci 61.8% one-week and Fibonacci 38.2% one-month meet.
Here is how it looks on the tool
About Technical Confluences Detector
The TCD (Technical Confluences Detector) is a tool to locate and point out those price levels where there is a congestion of indicators, moving averages, Fibonacci levels, Pivot Points, etc. If you are a short-term trader, you will find entry points for counter-trend strategies and hunt a few points at a time. If you are a medium-to-long-term trader, this tool will allow you to know in advance the price levels where a medium-to-long-term trend may stop and rest, where to unwind positions, or where to increase your position size.