USD/CNH Price Analysis: Remains sidelined between 100 and 50-DMA
- USD/CNH maintains one-week-old trading range, recently off daily top.
- Downbeat Momentum, sustained break of two-month-old trend line favor sellers.
- Key Fibonacci retracement levels add strength to the trading filters.
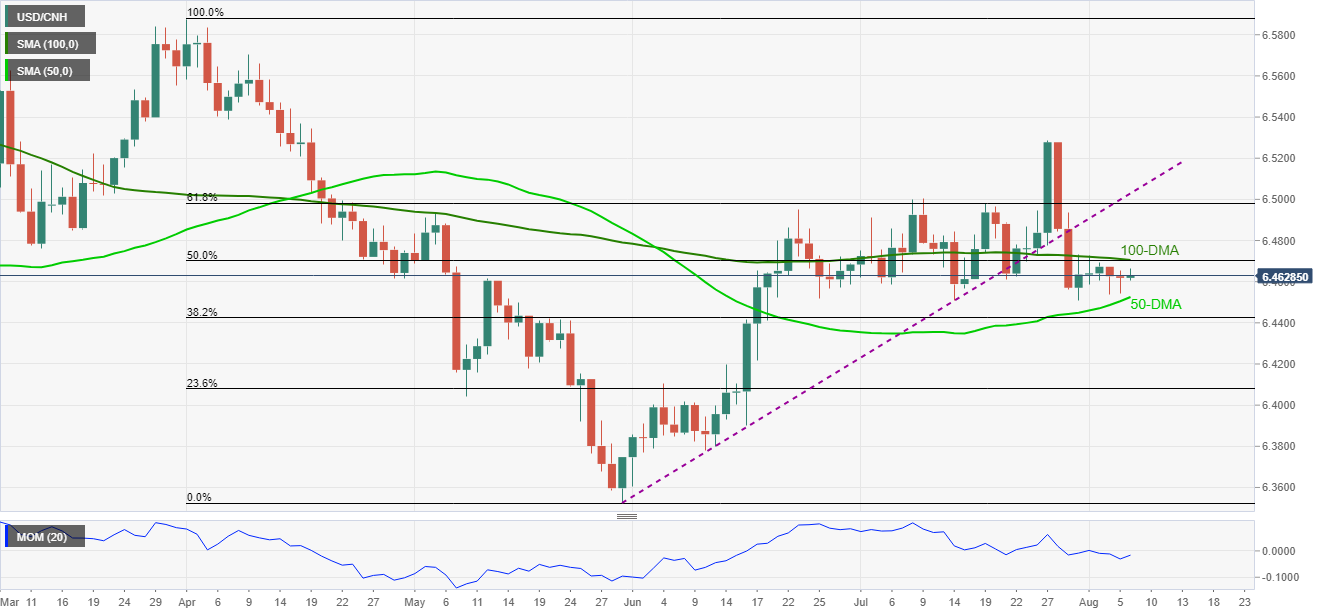
USD/CNH holds onto the short-term trading range choppy range despite recently easing to 6.4625 during early Friday. In doing so, the offshore Chinese currency (CNH) pair stays inside the key moving-average envelope amid descending Momentum line.
It should be noted that the 50% Fibonacci retracement of April–May downside adds strength to the upper limit of the short-term trading range, also comprising 100-DMA, around 6.4700.
On the contrary, a daily closing below 50-DMA level of 6.4525, will need validation from July’s low surrounding 6.4510 and the 6.4500 to convince the USD/CNH bears.
Meanwhile, the pair’s keeping of the late July’s pullback from mid-April highs and a breakdown of an ascending support line from May 31 back the sellers.
Additionally, the pair’s surprise run-up beyond 6.4700 resistance confluence will be challenged by the 61.8% Fibonacci retracement and the previous support line, respectively around 6.4980 and 6.5030.
Overall, USD/CNH portrays bearish consolidation but a clear downside break of 50-DMA becomes necessary to trigger the fall.
USD/CNH: Daily chart
Trend: Weakness expected