Gold Price Analysis: XAU/USD eyes $1717 key support ahead of Powell – Confluence Detector
Gold (XAU/USD) is under pressure below $1750, courtesy of the resurgent haven demand for the US dollar across the board. The Turkish central bank upheaval over the weekend and overheating fears continue to boost the greenback’s safe-haven appeal. Also, the Fed’s decision to let a capital break on big banks expire on Friday weighs negatively on gold.
Next of note for gold remains a slew of Fedspeak due later on Monday, with the Fed Chair Jerome Powell’s speech eagerly awaited.
How is gold positioned on the charts?
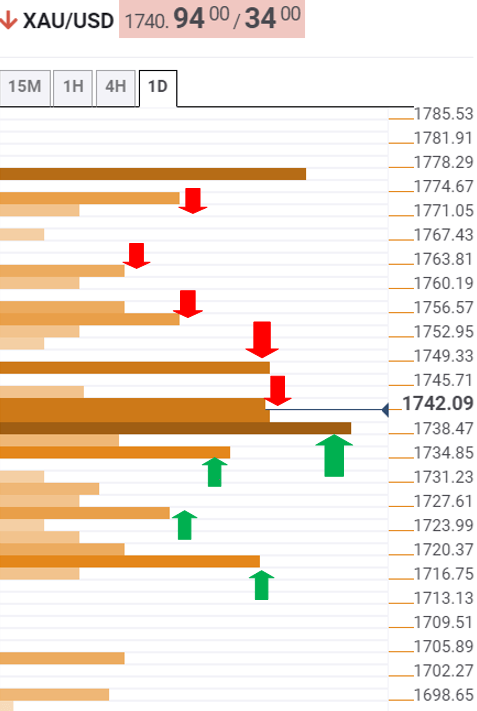
Gold Price Chart: Key resistance and support levels
The Technical Confluences Detector shows that gold is challenging the bears’ commitments at the fierce support of $1737, which is the intersection of the previous low four-hour, SMA10 four-hour and SMA5 one-day.
A breach of the last would expose the Fibonacci 61.8% one-week at $1733.
The next relevant cushion for the XAU bulls is seen at $1725, where the pivot point one-week S1 intersect with the Bollinger Band four-hour lower.
The confluence of the previous month low and Fibonacci 161.8% one-day at $1717 offers strong support, which will be a tough nut to crack for the XAU sellers.
On the flip side, a dense cluster of resistance levels is aligned around $1743, the meeting point of the SMA5 four-hour, Fibonacci 38.2% one-week and Fibonacci 23.6% one-day.
The next upside target is placed at $1747, the Friday’s high and Fibonacci 23.6% one-week.
The Fibonacci 23.6% one-week at $1754 is the next relevant barrier for the buyers.
Further up, the pivot point one-week R1 at $1762 would get tested, opening doors towards the $1772 resistance. That level is the pivot point one-day R3.
Here is how it looks on the tool
About Technical Confluences Detector
The TCD (Technical Confluences Detector) is a tool to locate and point out those price levels where there is a congestion of indicators, moving averages, Fibonacci levels, Pivot Points, etc. Knowing where these congestion points are located is very useful for the trader, and can be used as a basis for different strategies.