Back
10 Sep 2020
Gold Price Analysis: XAU/USD rejected above $1,950 despite bullish candlestick pattern
- Gold fails to chew through offers around $1,950.
- The daily chart shows a bullish Doji reversal pattern.
Gold is trading near $1,945 at press time, representing a 0.10% decline on the day.
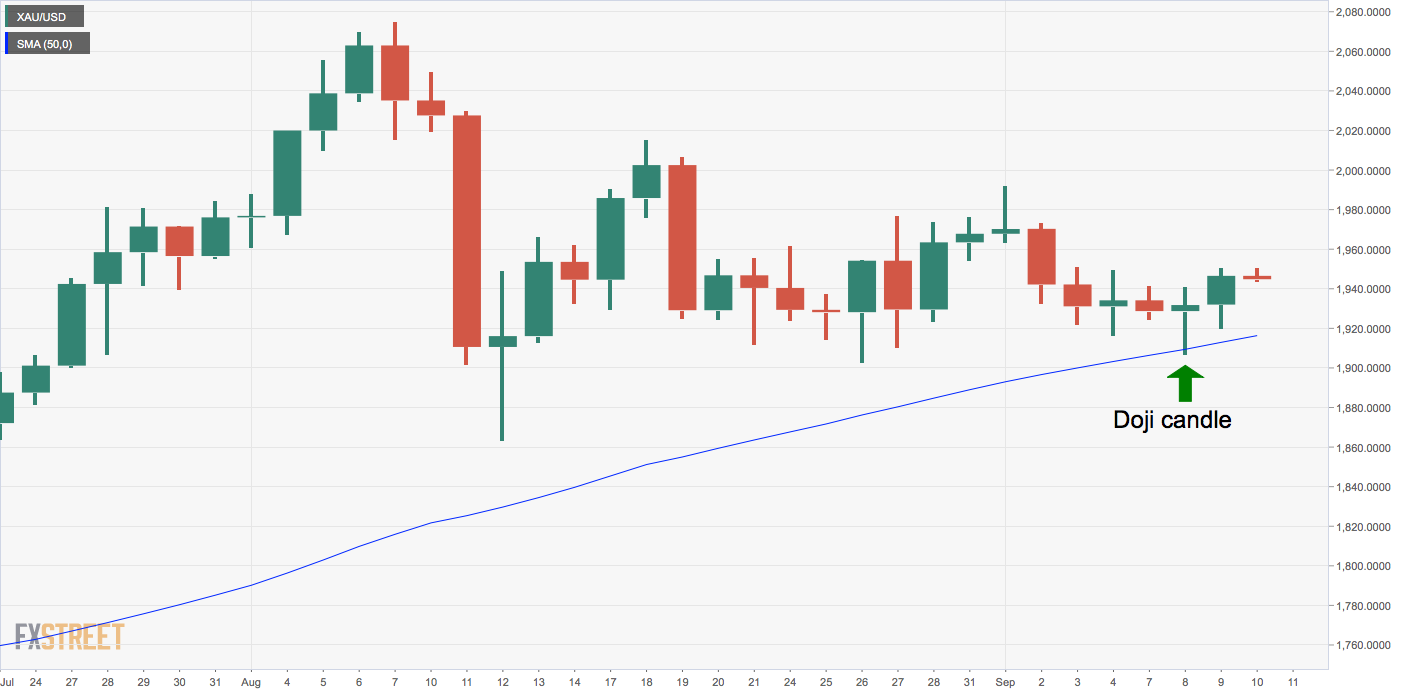
The yellow metal closed Wednesday with 0.8% gains, marking a positive follow-through to Tuesday's Doji candle. In other words, the daily chart now shows a bullish Doji reversal pattern.
So far, however, that has failed to invite stong chart-driven selling. Gold faced rejection at $1,950 an hour ago and is currently trading in the red.
Key support levels are located at $1,916 (50-day SMA) and $$1,906 (Tuesday's low). Meanwhile, resistance levels are seen at $1,950 (session high) and $1,978 (trendline falling from Aug. 18 and Sept. 1 highs).
The bullish Doji reversal pattern would remain valid while prices are held above $1,906.
Daily chart
Trend: Bullish
Technical levels