S&P 500 stages technical correction, bullish outlook remains intact
- S&P 500 turns south after climbing to fresh multi-month highs on Monday.
- Dail RSI is inching lower toward 70, pointing out to a technical correction.
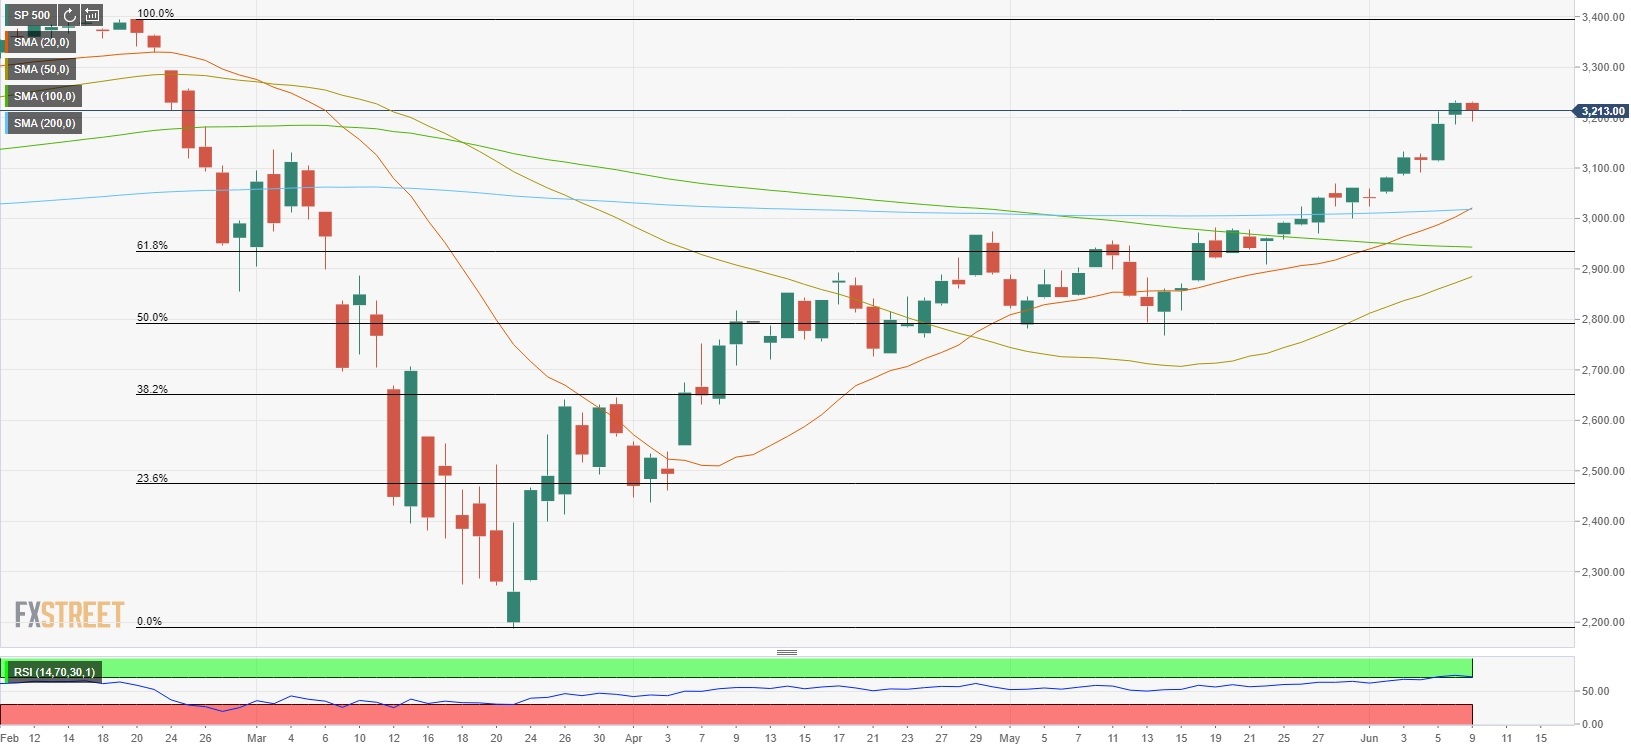
The S&P 500 Index (SPX) gained more than 1% and touched its highest level since late February at 3,233 points. With investors looking to book their profits ahead of Wednesday's FOMC announcements, the index is staging a technical correction and was last seen losing 0.6% on the day at 3,213 points.
S&P 500 technical outlook
Tuesday's fall seems to be a technical correction rather than a fundamentally driven selloff. The Relative Strength Index (RSI) indicator on the daily chart climbed above 70 on Monday to show that the index became technically oversold. The RSI still remains a tad above 70, suggesting that the index continue to inch lower before trying to push higher.
On the upside, the initial resistance for the index aligns at 3,234 (2019 closing level/Monday high) ahead of 3,300 (psychological level). Supports, on the other hand, could be seen at 3,180 (Feb. 26 high/last week's closing level), 3,020 (200-day SMA/20-day SMA).
S&P 500 daily chart
 Additional technical levels