NZD/USD Price Analysis: Nears short-term support trendline
- NZD/USD remains under pressure for the third day in a row.
- 38.2% Fibonacci retracement, February-end low can offer intermediate halt.
- The weekly resistance line holds the gate for the fresh run-up.
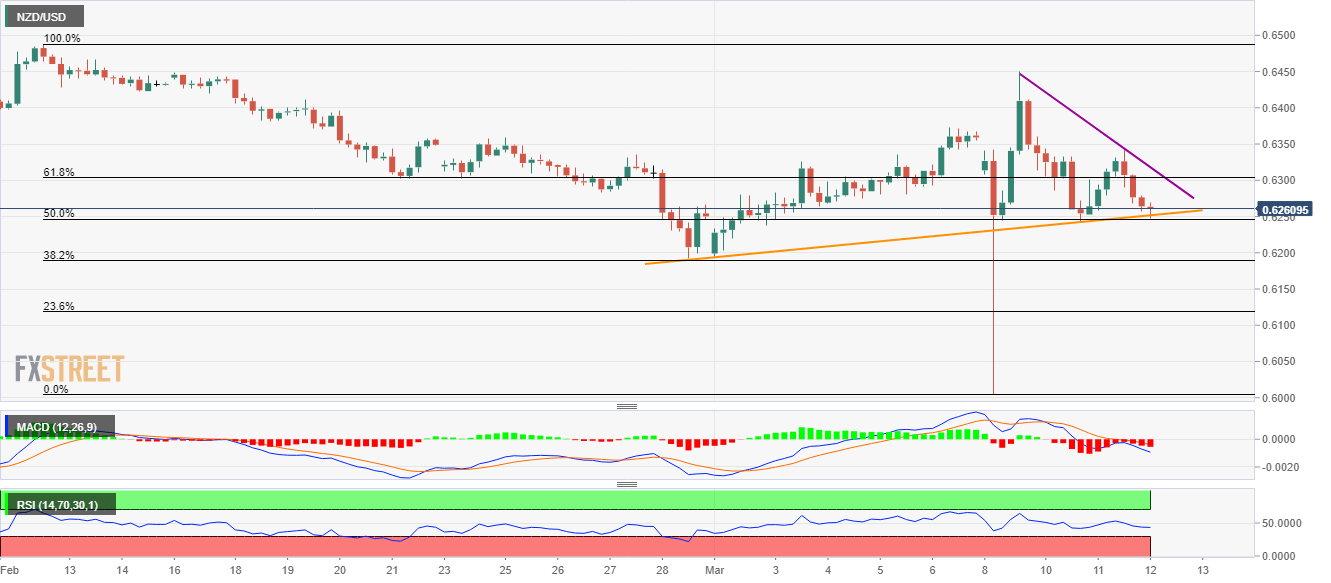
While extending its fall since the week’s start, NZD/USD declines 0.16% to 0.6260 during the early Thursday. Even so, the pair rests on a short-term ascending trend line that holds the key to its further downside.
Should the pair manages to remain weak below 0.6250 support, lows marked during February-end, also comprising 38.2% Fibonacci retracement of the pair’s declines from February 12, near 0.6190 can lure the bears.
In a case where the kiwi prices fail to reverse from 0.6190, the early-March bottom near 0.6000 can return to the charts.
Alternatively, 61.8% Fibonacci retracement near 0.6300 can offer immediate resistance ahead of the weekly trend line, at 0.6320 now.
Though, the pair’s sustained break of 0.6320 enables it to aim for the monthly top near 0.6450.
NZD/USD four-hour chart
Trend: Pullback expected