Back
20 Feb 2020
USD/INR New York Price Analysis: Dollar hits six-week high vs. Indian rupee
- USD/INR is trading at levels not seen since early January.
- The level to beat for bulls is the 72.00 resistance.
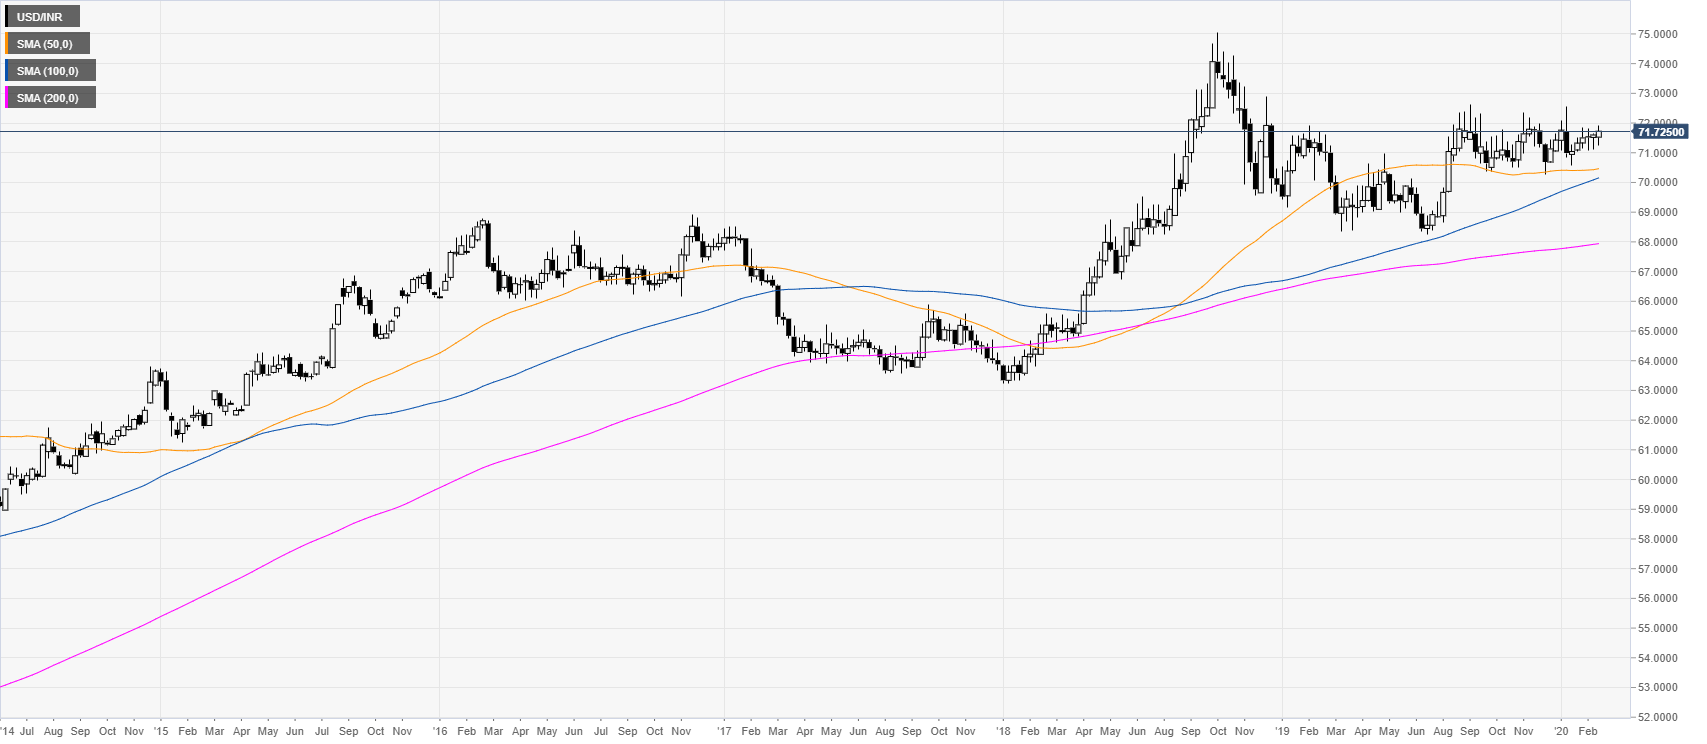
USD/INR weekly chart
Following the 2018 bull-run, the spot has been consolidating in a rectangle pattern. USD/INR is trading above the main weekly simple moving averages (SMAs), suggesting a bullish bias in the long term.
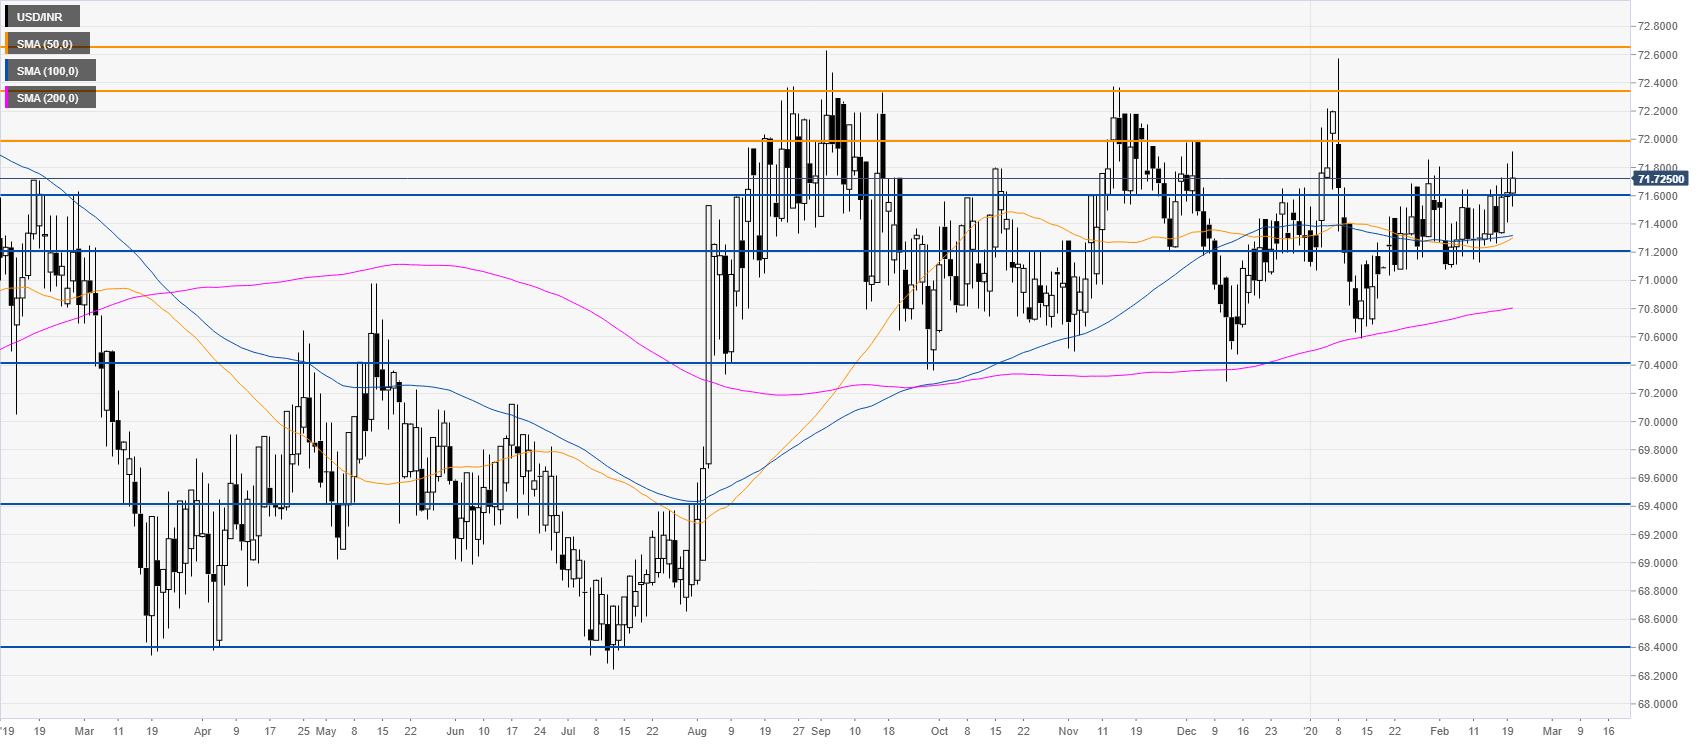
USD/INR daily chart
USD/INR rose to six-week highs and almost reached the 72.00 figure. It has since then retraced a little still trading above the 71.60 level. Bulls need a daily close above the 72.00 level in order to eye higher level near 72.35 and 72.66. Support is seen near 71.60 and 71.20 levels.
Additional key levels