WTI Technical Analysis: 200-week EMA, 50% Fibonacci guard immediate upside
- WTI fails to extend last week’s run-up, pulls back from 200-week EMA.
- Five-week-old rising trend line gains sellers’ attention, multi-month long resistance will lure buyers past-50% Fibonacci retracement.
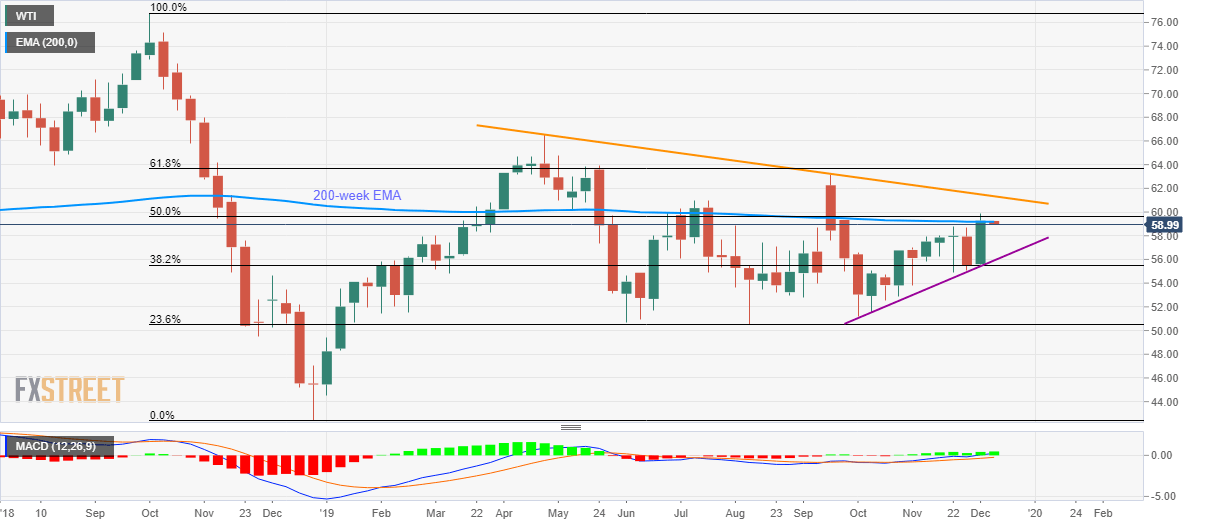
WTI drops to sub-$59.00 area during early Monday. The pair’s failed to provide a decisive break beyond 200-week Exponential Moving Average (EMA) and 50% Fibonacci retracement of October-December 2018 fall.
The energy benchmark now seems to extend declines towards $57.00 while an upward sloping trend line since early October, at $55.90, can act as an intermediate halt to its downpour towards 38.2% Fibonacci retracement of $55.50.
During the black gold’s declines below $55.50, August month low near $50.50 and $50.00 round-figure will be on the Bears’ radars.
On the flip side, a weekly closing beyond 50% Fibonacci retracement level of $59.60 can take aim at a multi-month-old descending resistance line, at $61.33.
However, the price rally beyond $61.33 enables the Bulls to question September high of $63.13 while also targeting the yearly top surrounding $66.60 during further upside.
WTI weekly chart

Trend: Pullback expected
