Back


2 Dec 2019
GBP/USD Technical Analysis: Cable trades near session’s highs above the 1.2900 handle
- The cable closed the weekly opening gap at the start of the New York session.
- The level to beat for bulls is the 1.2953 resistance.
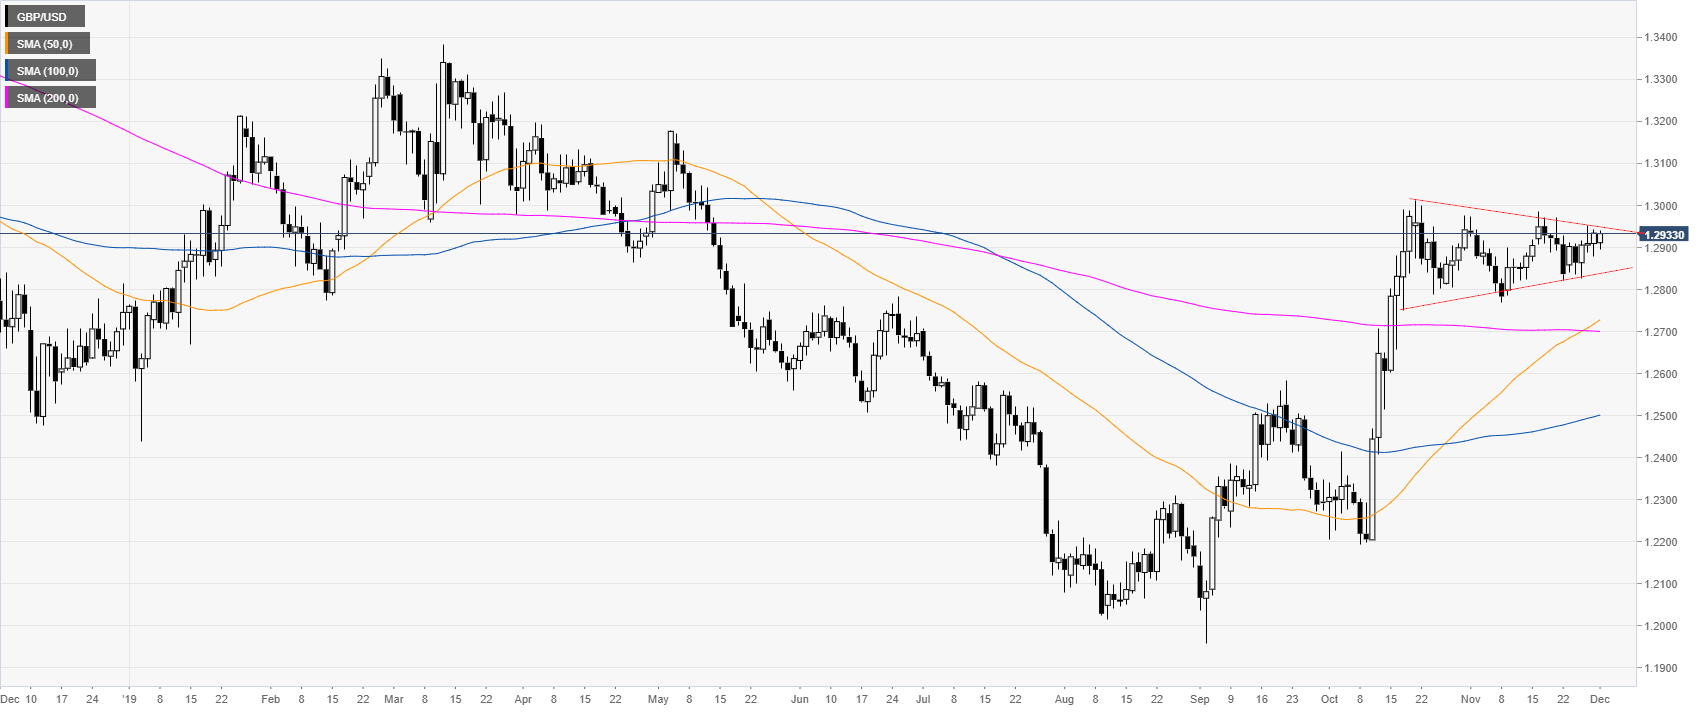
GBP/USD daily chart
The market is starting November holding above the 1.2900 handle while trading above the main SMAs. The market in November consolidated the October gains in a triangle formation.

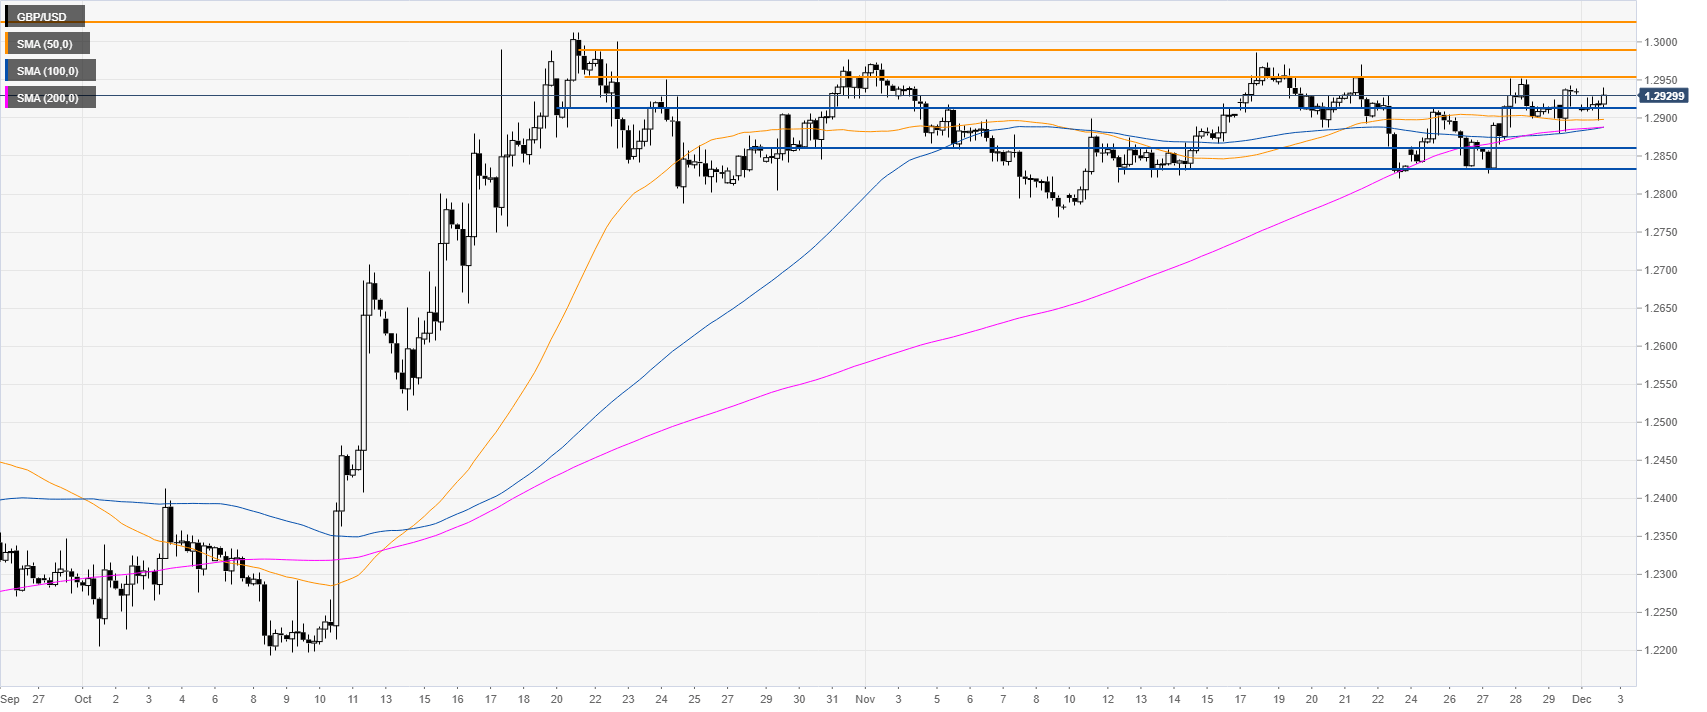
GBP/USD four-hour chart
The market is trading quietly above the main SMAs. As the underlying bias is bullish, the buyers will likely try to break above the 1.2953 resistance to reach the 1.2990 and 1.3025 levels on the way up, according to the Technical Confluences Indicator.
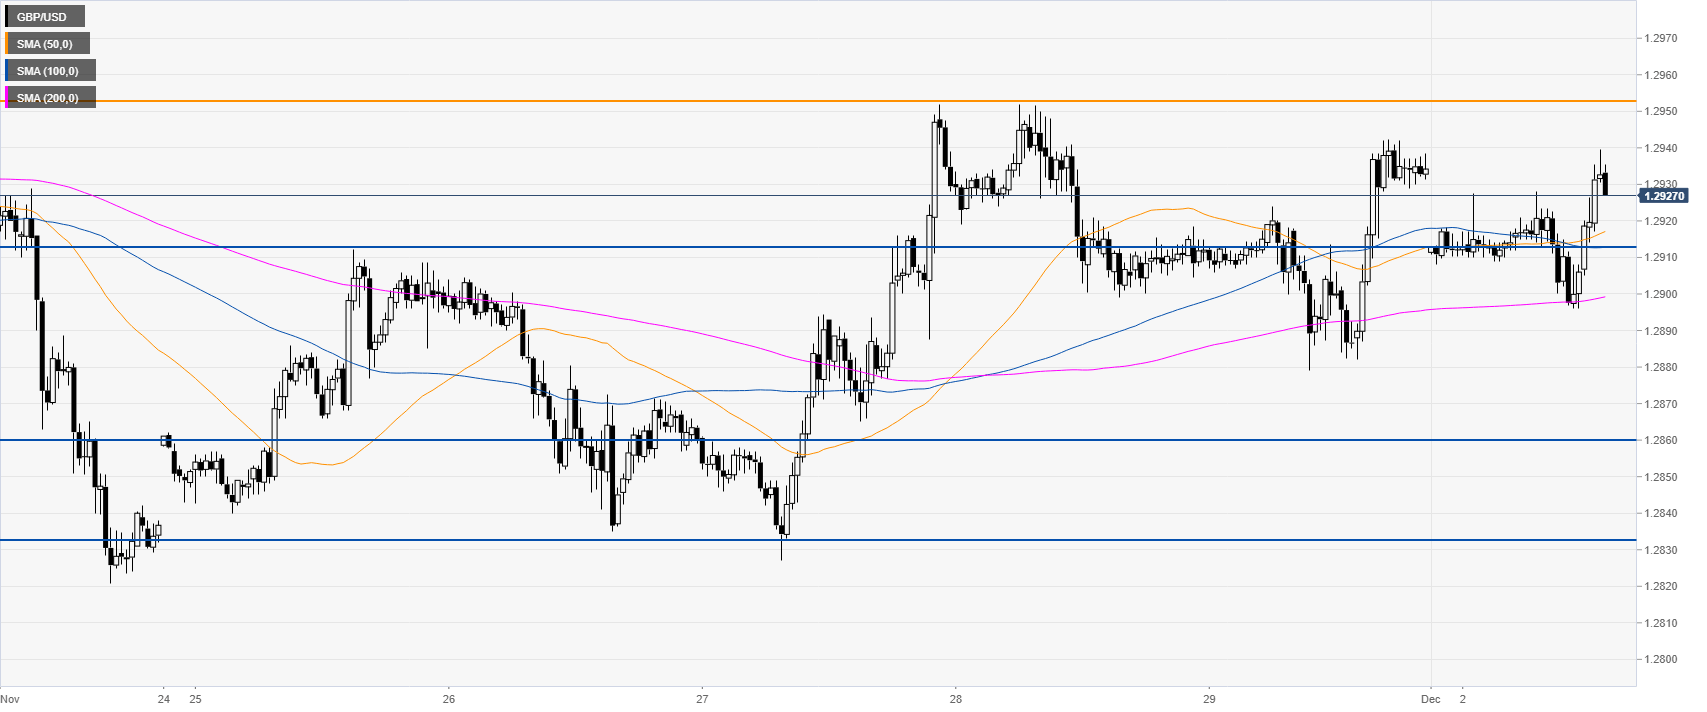
GBP/USD 30-minute chart
GBP/USD closed the Sunday opening gap while challenging the daily high. Immediate support is seen at the 1.2913 level. Further down lie the 1.2860 and 1.2832 price levels.

Additional key levels

