Back
29 Oct 2019
USD/IDR technical analysis: Spinning bottom on D1 favors further recovery
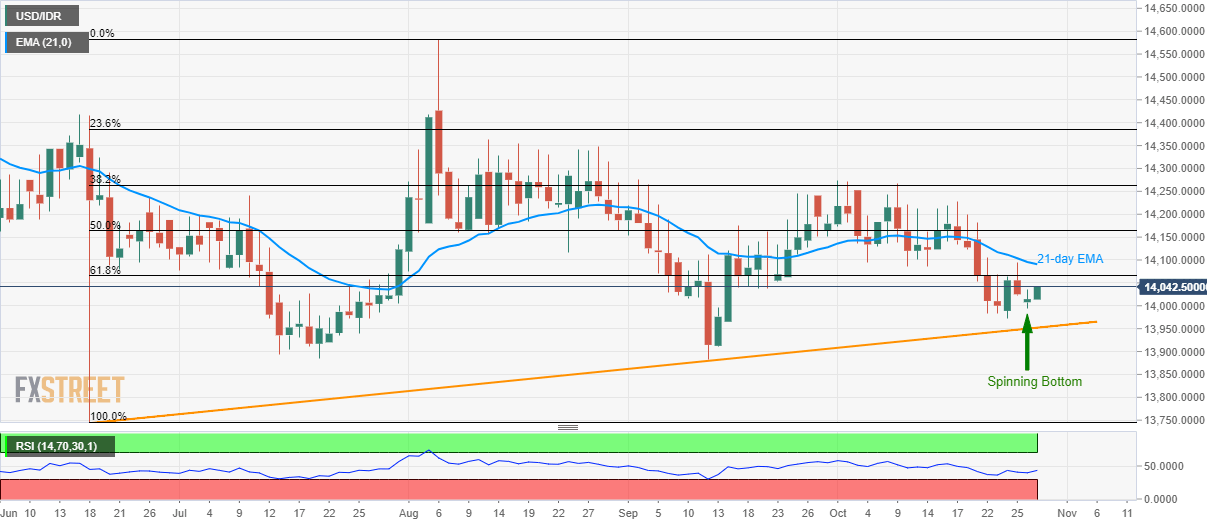
- USD/IDR takes the bids towards 61.8% Fibonacci retracement after the recent bullish candlestick formation.
- A downside break below the multi-month-old rising trend line will please bears.
Following the bullish candlestick formation on Monday, as per the daily (D1) chart, the USD/IDR pair takes the bids to 14,042 by the press time of early Tuesday.
The quote now rises towards 61.8% Fibonacci retracement of June-August upside, at 14,065, ahead of confronting 21-day Exponential Moving Average (EMA) level of 14,090.
Buyers could cheer the break of 14,090 by challenging 50% and 38.2% Fibonacci retracements of 14,165 and 14,263 respectively,
On the contrary, the pair’s downside has been confined by the upward sloping trend line since June 18, at 13,952, a break of which could recall 13,880 and 13,750 on the chart.
USD/IDR daily chart

Trend: bullish
