Back
21 Oct 2019
NZD/USD technical analysis: Rises further towards 10-week-old resistance line
- NZD/USD surges to fresh five-week high.
- A falling trend line since August 09 holds the key to 38.2% Fibonacci retracement, 100-day EMA.
- 50-day EMA limits immediate declines.
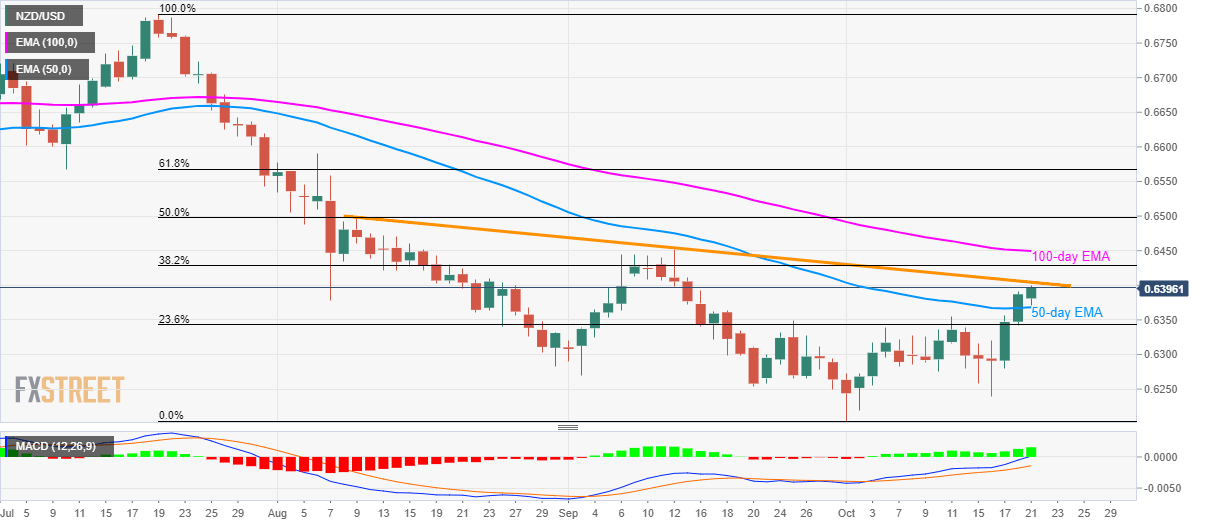
Sustained break of 50-day Exponential Moving Average (EMA) propels the NZD/USD pair towards near-term key resistance line as it takes the bids to 0.6400 amid early Monday.
With the 12-bar Moving Average Convergence and Divergence (MACD) indicating bullish signal, prices are likely to overcome 0.6405 immediate barrier.
As a result, 38.2% Fibonacci retracement of July-September declines, at 0.6430 and a 100-day EMA level of 0.6450 will become buyers’ favorites.
Meanwhile, pair’s declines below 50-day EMA level of 0.6368 can drag it back to 0.6350 and 23.6% Fibonacci retracement close to 0.6340. However, 0.6250 and 0.6200 will limit the pair’s further declines.
NZD/USD daily chart
Trend: pullback expected