Back
2 Oct 2019
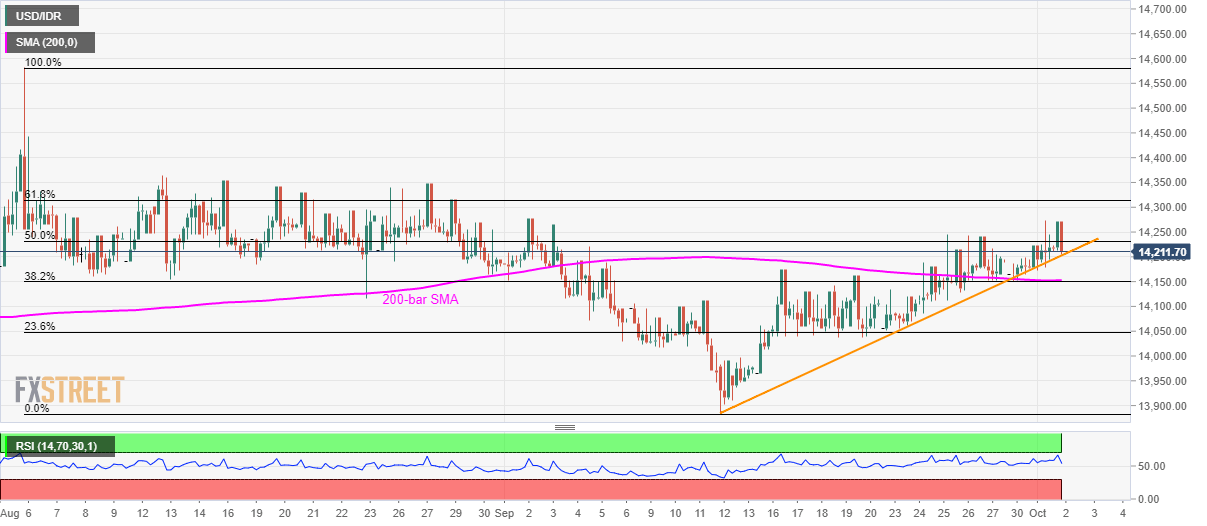
USD/IDR technical analysis: 3-week-old support trendline holds the key to 14,153/50 confluence
- Overbought RSI conditions trigger USD/IDR pullback to short-term support-line.
- 200-bar SMA, 38.2% Fibonacci retracement limit further declines.
- 61.8% Fibonacci retracement, late-August tops on the buyers’ radar.
Despite witnessing pullback, the USD/IDR pair remains above a three-week-old rising trend-line while taking rounds to 14,210 during early Wednesday.
Even if the pair slips below immediate support-line, at 14,200, a confluence of 200-bar simple moving average (SMA) and 38.2% Fibonacci retracement of August-September declines, around 14,153/50 can challenge sellers.
Should bears dominate past-14,150, 14,000 round-figure and September month low near to 13,880 will be on their watch-list.
In a case where bulls refrain from respecting the overbought condition of 14-bar relative strength index (RSI), 61.8% Fibonacci retracement level close to 14,315 and late-August highs surrounding 14,350/60 could flash on their radars.
USD/IDR daily chart
Trend: bullish