Back
22 Jul 2019
US Dollar Index technical analysis: DXY grinding up as bulls defend the 97.00 handle
- DXY is up little this Monday as the bulls keep the market above the 97.00 figure.
- The level to beat for buyers are seen at 97.30 and 97.55.
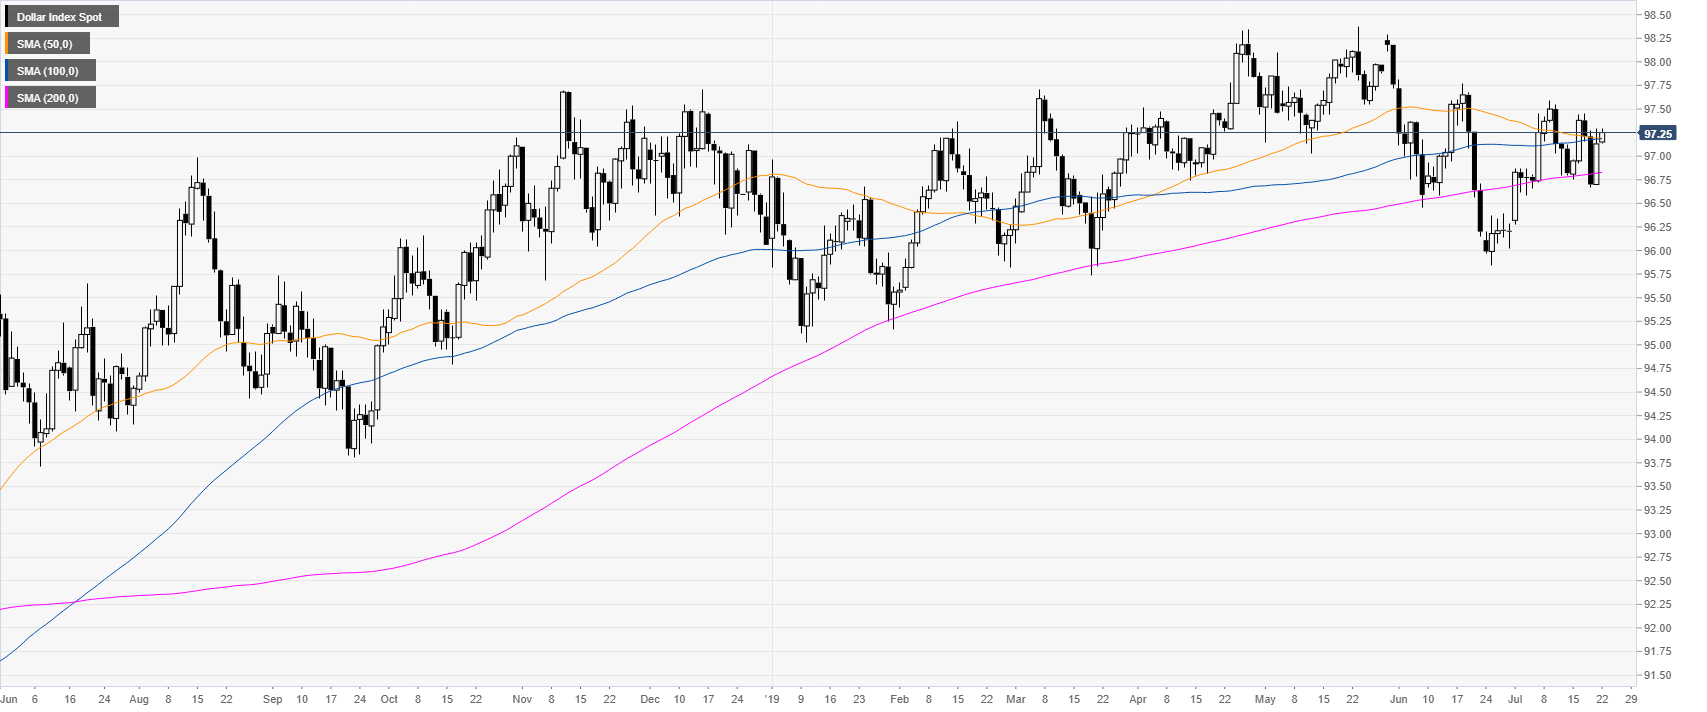
DXY daily chart
The US Dollar Index (DXY) is adding little gains this Monday as the market is trading above its main daily simple moving averages (DSMAs) and the 97.00 handle.
DXY 4-hour chart
DXY is challenging the 90.30 resistance level as it is trading above its main SMAs. The 97.55 and 97.80 resistances are likely the next main hurdles on the way up.

DXY 30-minute chart
The greenback is trading above its main SMAs suggesting bullish momentum in the near term. Immediate support is seen at the 97.15 and 97.00 levels.

Additional key levels