USD/CHF technical analysis: Oversold RSI, 61.8% Fibo. limit immediate declines
- Break of five-month-old support-line dragged the USD/CHF pair to the lowest since early-January.
- 61.8% Fibonacci retracement level offers immediate support while oversold RSI questions further downside.
Although break of medium-term ascending trend-line dragged USD/CHF to a 23-week low, 61.8% Fibonacci retracement of its September 2018 to April 2019 upside holds the pair’s declines captive as the quote seesaws near 0.9820 ahead of the European open on Friday.
Oversold levels of 14-day relative strength index (RSI) increase the importance of 0.9807 support, a break of which can magnify the pair’s weakness towards flashing early-September 2018 high near 0.9768.
Should there be additional south-run below 0.9768, 0.9700 could become bears’ best choice.
On the flip side, a successful break of support-turned-resistance of 0.9870 becomes necessary to aim for 50% Fibonacci retracement of 0.9890.
During the pair’s extended recovery past-0.9890, 0.9955 and 200-day simple moving average (SMA) around 38.2% Fibonacci retracement of 0.9972 can lure the bulls.
USD/CHF daily chart
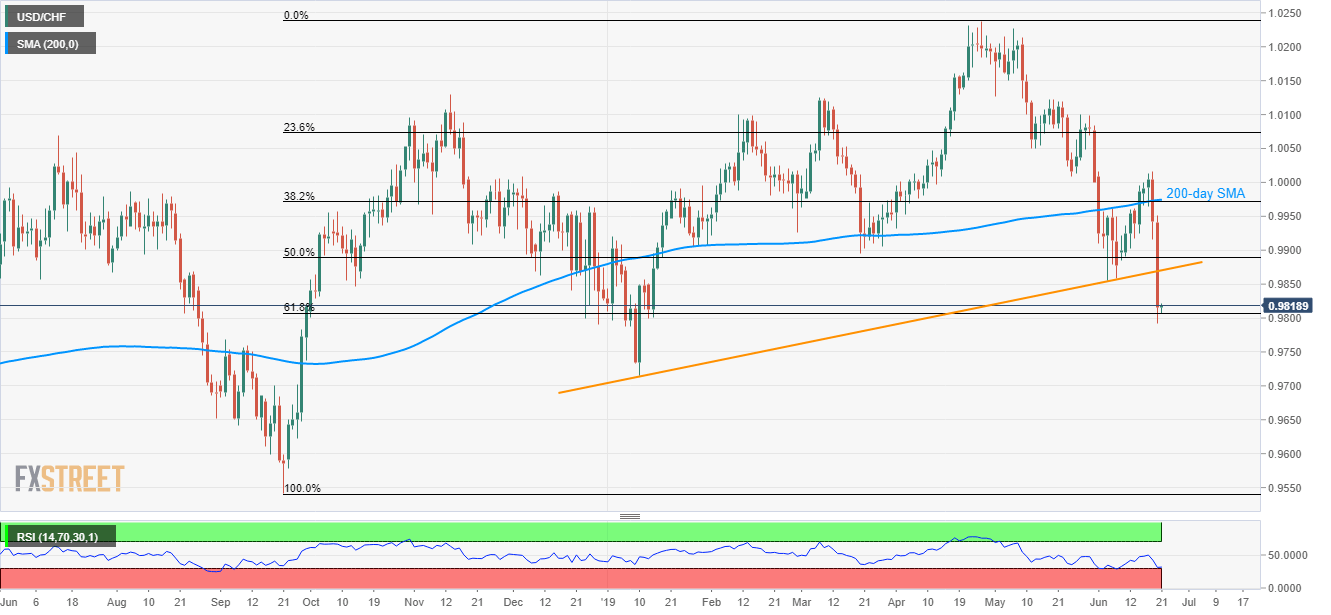
Trend: Pullback expected