GBP/USD Technical Analysis: Cable down small on US GDP - Bulls hold on tight near 1.3280 level
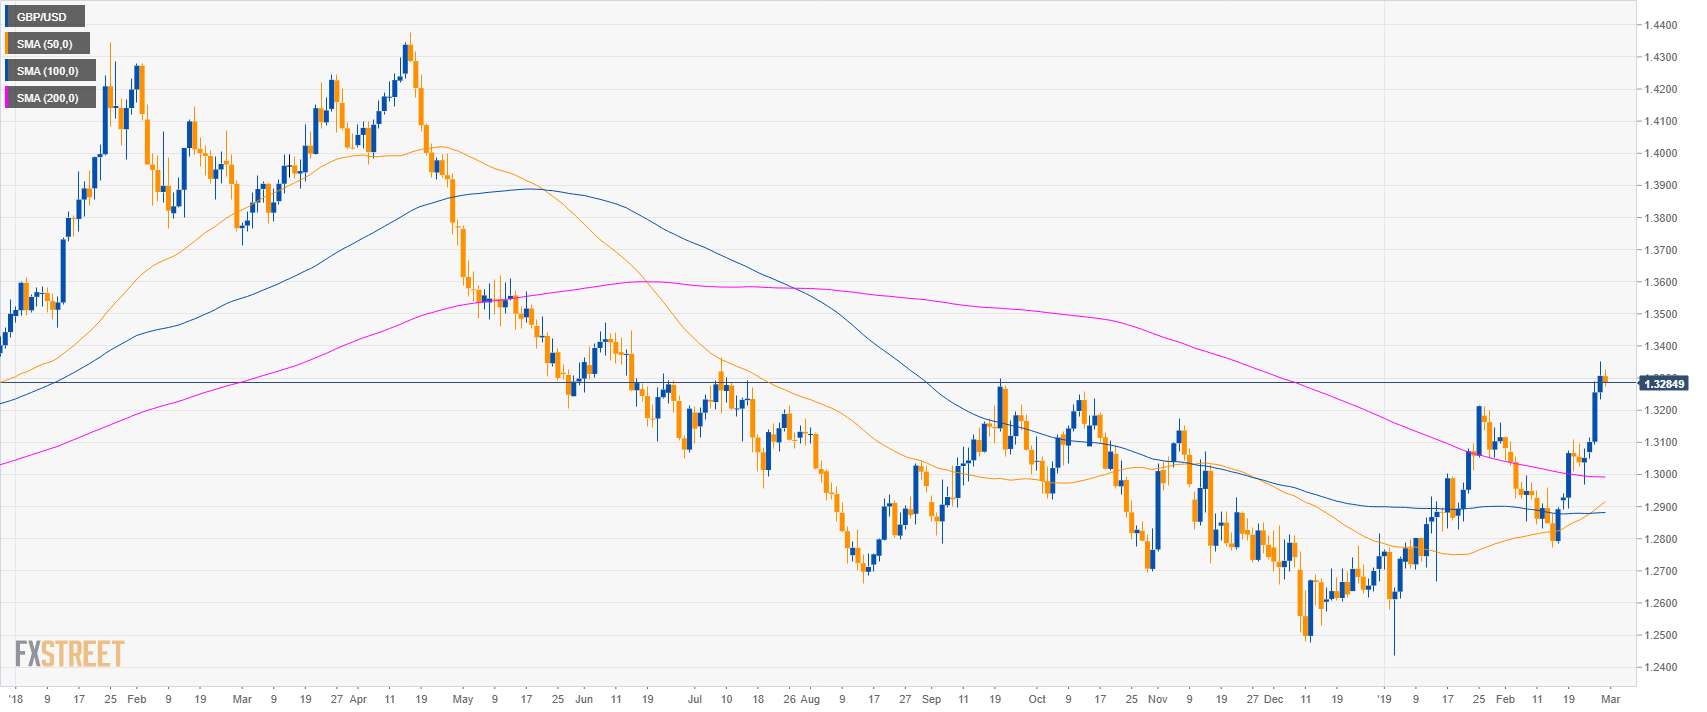
GBP/USD daily chart
- GBP/USD is trading above the 1.13200 figure and its main simple moving averages suggesting bullish momentum.
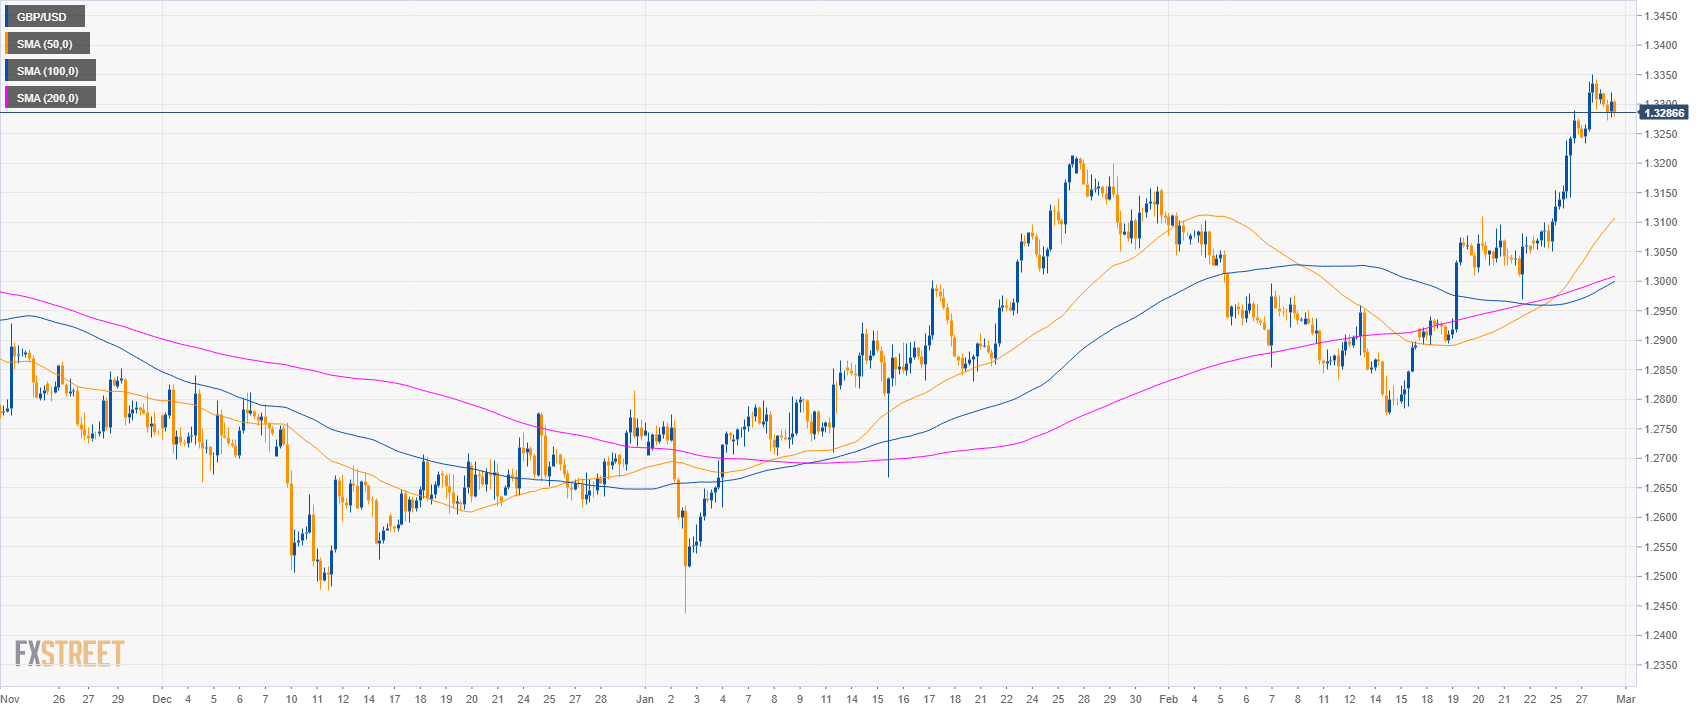
GBP/USD 4-hour chart
- GBP/USD is trading above its main SMAs suggesting bullish momentum in the medium-term.
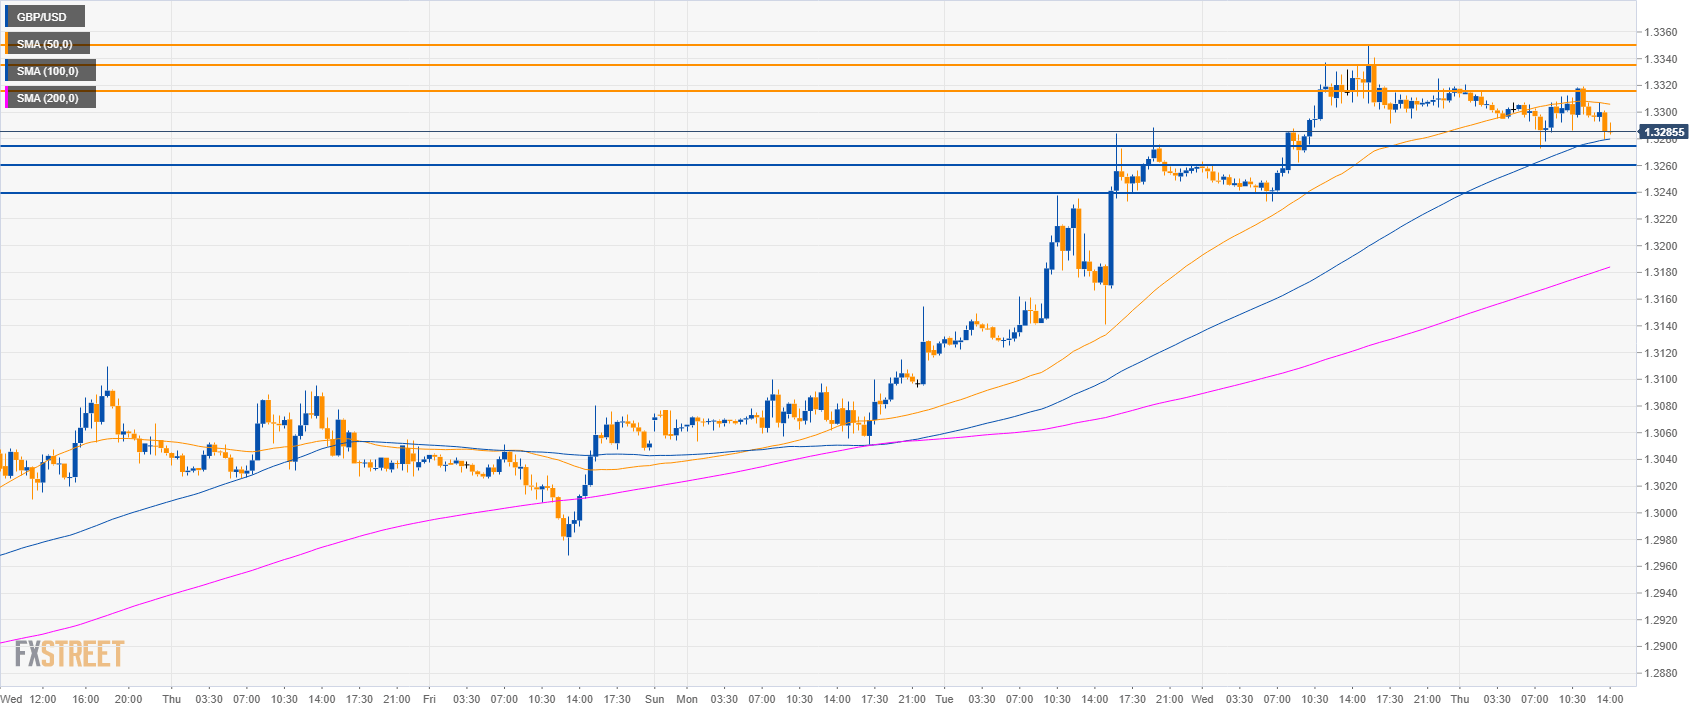
GBP/USD 30-minute chart
- GBP/USD is trading above the 100 and 200 SMA suggesting bullish momentum.
- GBP/USD next bullish targets are at 1.3315, 1.3334 and 1.3350 level.
- Support is at 1.3275, 1.3260 and 1.13240 level.
Additional key levels
GBP/USD
Overview:
Today Last Price: 1.3285
Today Daily change: -22 pips
Today Daily change %: -0.17%
Today Daily Open: 1.3307
Trends:
Daily SMA20: 1.3005
Daily SMA50: 1.2903
Daily SMA100: 1.2881
Daily SMA200: 1.2992
Levels:
Previous Daily High: 1.3351
Previous Daily Low: 1.3233
Previous Weekly High: 1.3109
Previous Weekly Low: 1.2891
Previous Monthly High: 1.3214
Previous Monthly Low: 1.2438
Daily Fibonacci 38.2%: 1.3306
Daily Fibonacci 61.8%: 1.3278
Daily Pivot Point S1: 1.3243
Daily Pivot Point S2: 1.3179
Daily Pivot Point S3: 1.3125
Daily Pivot Point R1: 1.3361
Daily Pivot Point R2: 1.3415
Daily Pivot Point R3: 1.3479