EUR/GBP Technical Analysis: Sellers aim for 0.8655 on the break of 0.8710
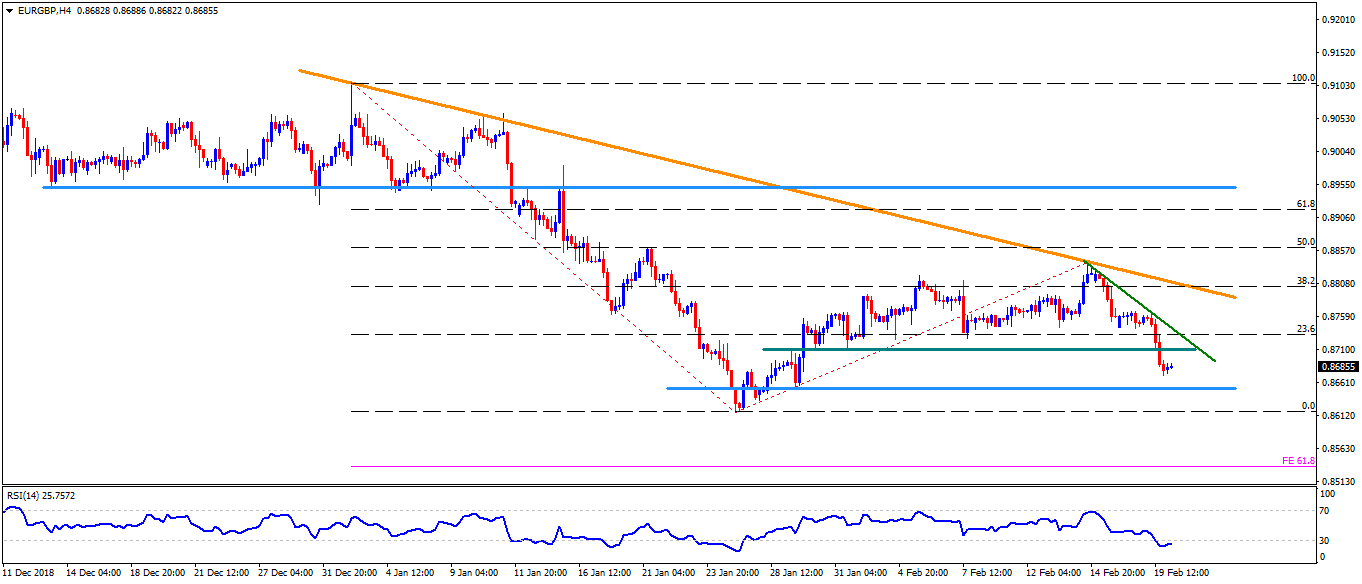
- EUR/GBP trades near 0.8690 heading towards European open on Wednesday.
- The pair slid beneath 0.8710 horizontal-support connecting late-January lows, which in turn opens the door for an extended decline to 0.8655 support.
- However, oversold levels of 14-bar relative strength index (RSI) may limit the pair’s downside around 0.8655, if not then 0.8615 and 61.8% Fibonacci expansion of its moves from January to mid-February, at 0.8535, can mark their presence on the chart.
- On the flipside, 0.8690 and immediate descending trend-line, at 0.8750, can restrict the pair’s near-term advances.
- In case prices rally beyond 0.8750, 0.8765 and 0.8790 may please the buyers ahead of luring them towards seven-week-old downward sloping resistance-line, at 0.8810.
EUR/GBP 4-Hour chart
Additional important levels:
Overview:
Today Last Price: 0.8686
Today Daily change: 5 pips
Today Daily change %: 0.06%
Today Daily Open: 0.8681
Trends:
Daily SMA20: 0.8745
Daily SMA50: 0.8872
Daily SMA100: 0.8854
Daily SMA200: 0.8864
Levels:
Previous Daily High: 0.8764
Previous Daily Low: 0.8671
Previous Weekly High: 0.8842
Previous Weekly Low: 0.8743
Previous Monthly High: 0.9119
Previous Monthly Low: 0.8617
Daily Fibonacci 38.2%: 0.8707
Daily Fibonacci 61.8%: 0.8729
Daily Pivot Point S1: 0.8647
Daily Pivot Point S2: 0.8612
Daily Pivot Point S3: 0.8553
Daily Pivot Point R1: 0.874
Daily Pivot Point R2: 0.8799
Daily Pivot Point R3: 0.8834