EUR/GBP Technical Analysis: Euro erasing Thursday’s gains against Sterling
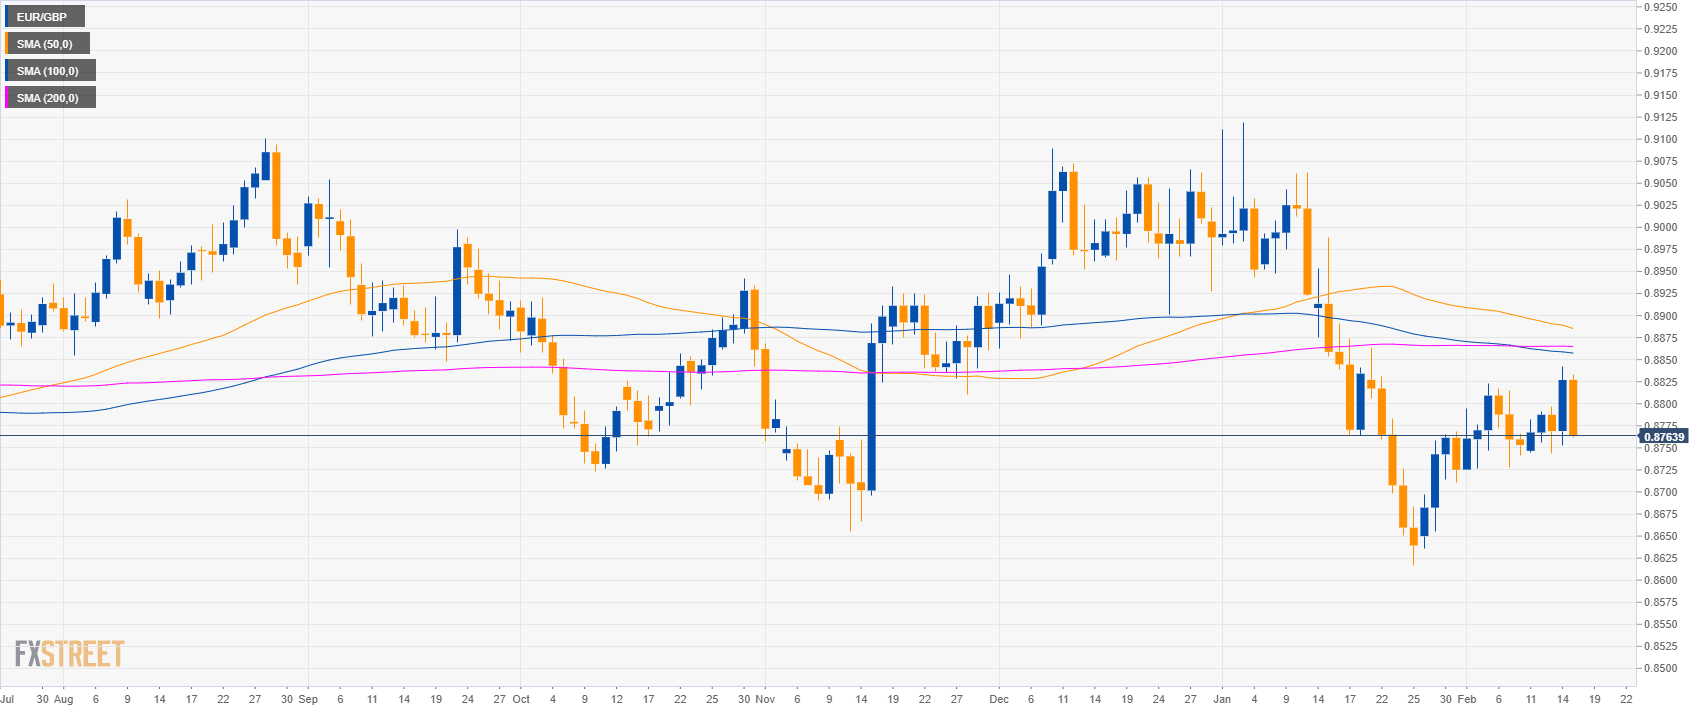
EUR/GBP daily chart
- EUR/GBP is trading in a sideways trend below the 200-day simple moving averages (SMAs).
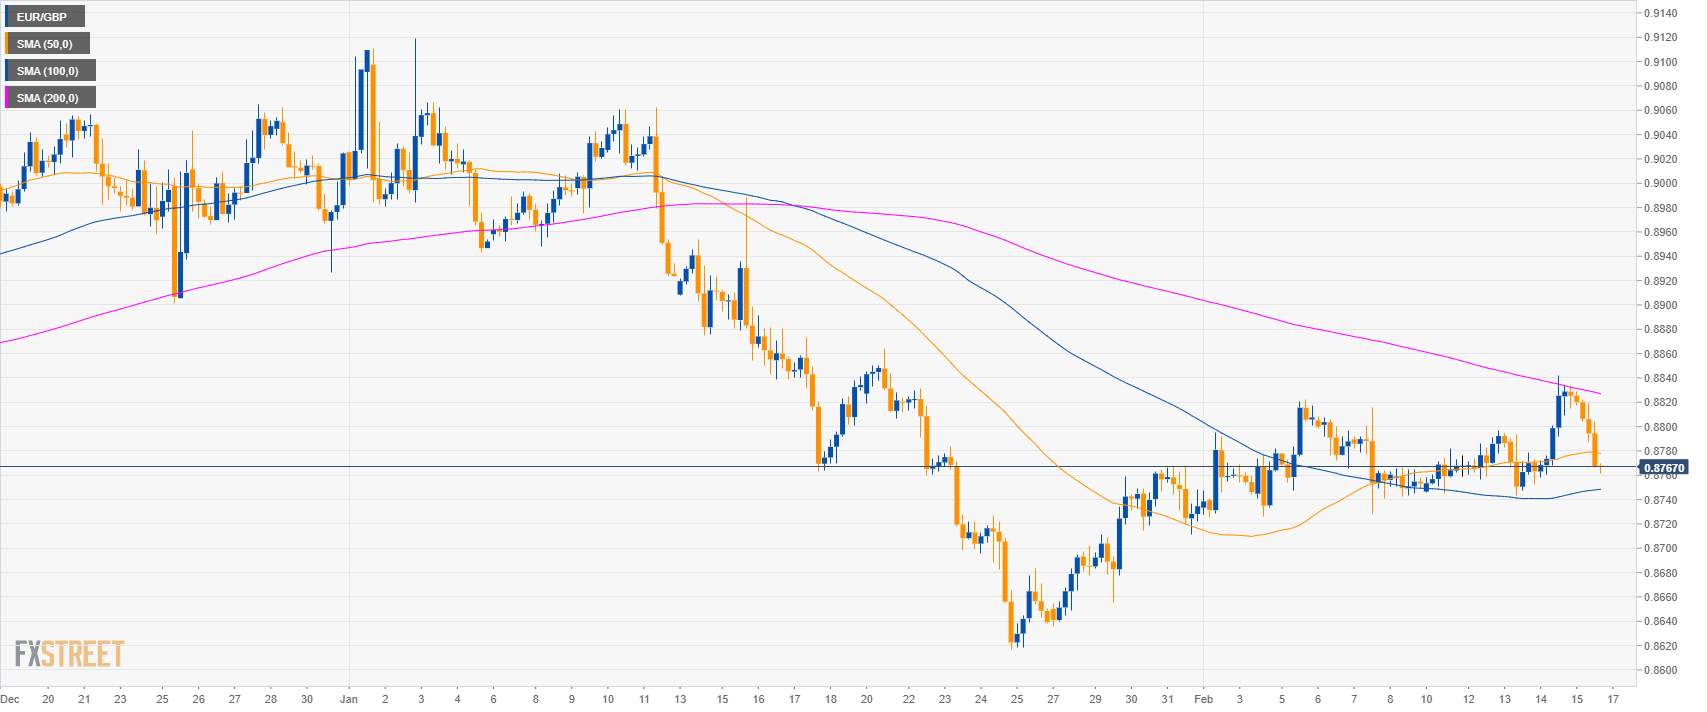
EUR/GBP 4-hour chart
- EUR/GBP is trading between the 50 and 100 SMAs on the 4-hour chart suggesting a sideways market in the medium-term.
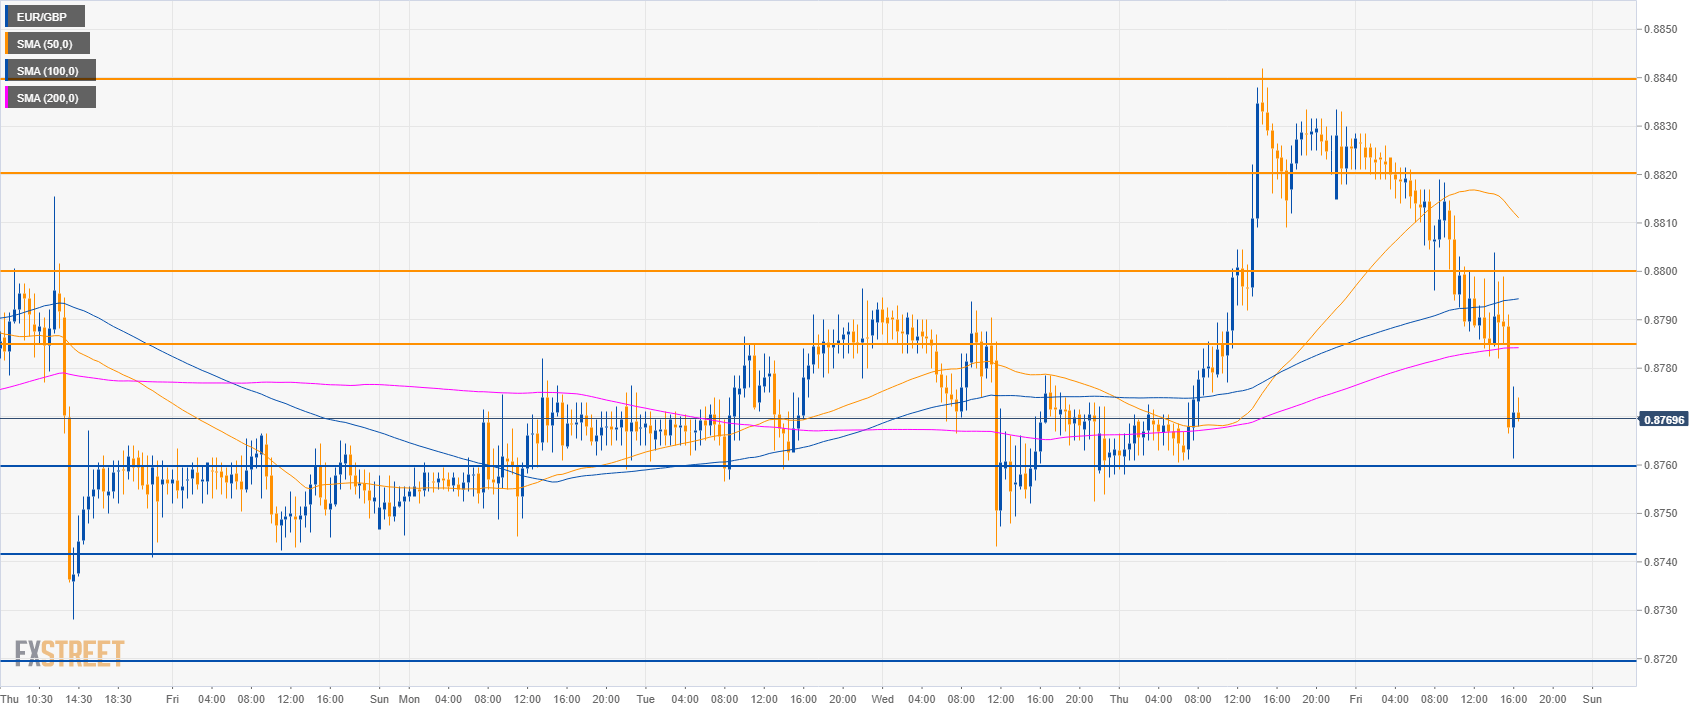
EUR/GBP 30-minute chart
- EUR/GBP is trading below the main SMAs suggesting bearish momentum in the short-term.
- EUR/GBP is back into the week’s range as it is trying to find support at 0.8760. Further down supports are seen near 0.8820 and 0.8800 figure.
- Resistance is seen at 0.8785, 0.8800 and 0.8820.
Additional key levels
EUR/GBP
Overview:
Today Last Price: 0.8771
Today Daily change: -56 pips
Today Daily change %: -0.63%
Today Daily Open: 0.8827
Trends:
Daily SMA20: 0.8756
Daily SMA50: 0.8889
Daily SMA100: 0.8859
Daily SMA200: 0.8865
Levels:
Previous Daily High: 0.8842
Previous Daily Low: 0.8752
Previous Weekly High: 0.8822
Previous Weekly Low: 0.8726
Previous Monthly High: 0.9119
Previous Monthly Low: 0.8617
Daily Fibonacci 38.2%: 0.8808
Daily Fibonacci 61.8%: 0.8787
Daily Pivot Point S1: 0.8772
Daily Pivot Point S2: 0.8718
Daily Pivot Point S3: 0.8683
Daily Pivot Point R1: 0.8862
Daily Pivot Point R2: 0.8897
Daily Pivot Point R3: 0.8951