EUR/GBP Technical Analysis: Euro above 0.8750 against Sterling
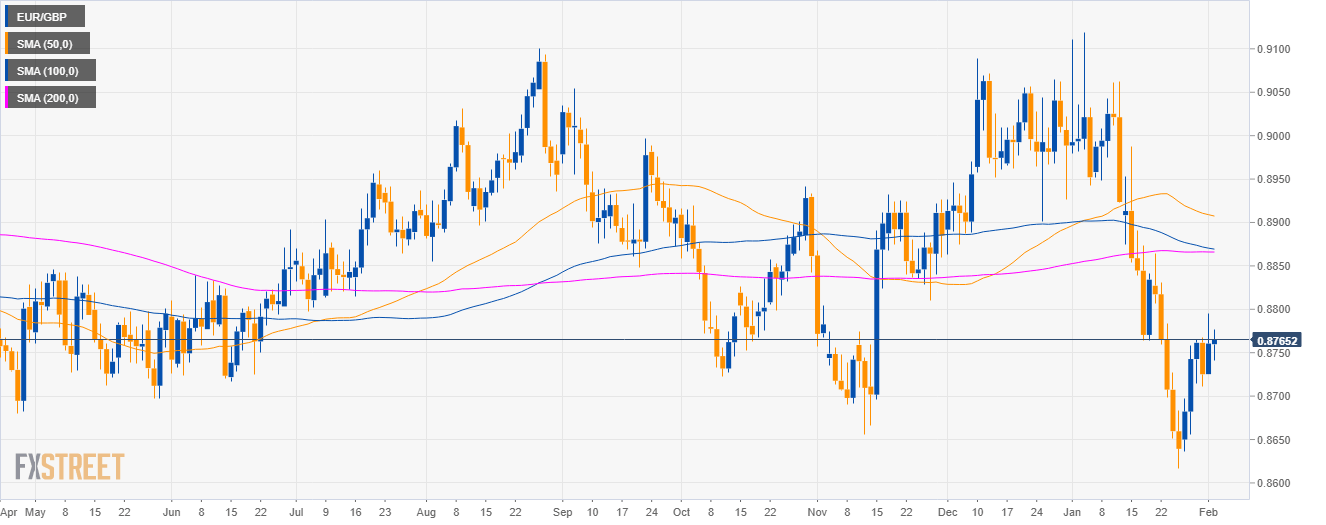
EUR/GBP daily chart
- EUR/GBP is trading in a sideways trend below the 200-day simple moving averages (SMAs).
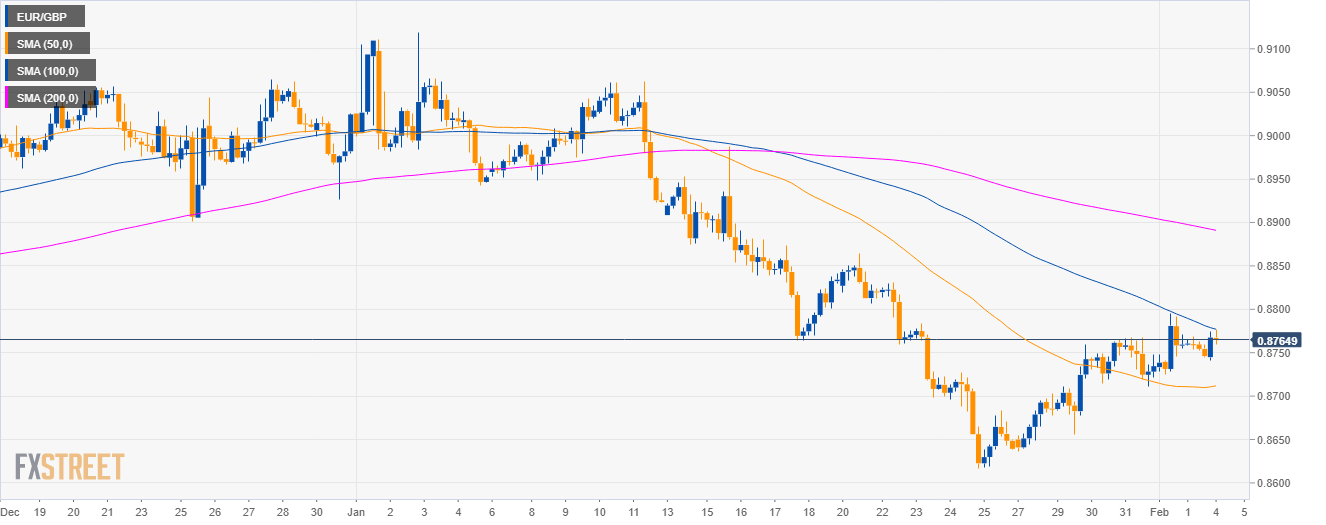
EUR/GBP 4-hour chart
- EUR/GBP is trading below the 100 and 200 SMA on the 4-hour chart.
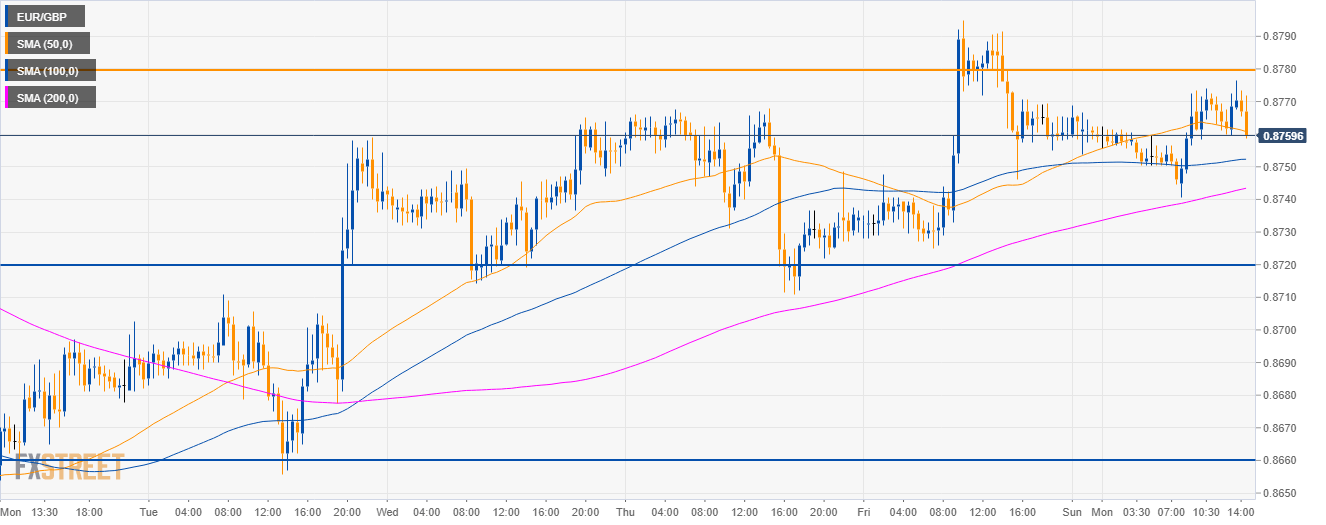
EUR/GBP 30-minute chart
- EUR/GBP has bullish momentum on lower-time frames.
- If the Euro bulls can break above 0.8780 key resistance, they can expect to reach 0.8840 level.
- To the downside, support is near 0.8720 and 0.8660 level. Euro bulls will likely not take the lead this Monday.
Additional key levels
EUR/GBP
Overview:
Today Last Price: 0.8762
Today Daily change: 2 pips
Today Daily change %: 0.02%
Today Daily Open: 0.876
Trends:
Daily SMA20: 0.8822
Daily SMA50: 0.8909
Daily SMA100: 0.8871
Daily SMA200: 0.8866
Levels:
Previous Daily High: 0.8795
Previous Daily Low: 0.8725
Previous Weekly High: 0.8795
Previous Weekly Low: 0.8636
Previous Monthly High: 0.9119
Previous Monthly Low: 0.8617
Daily Fibonacci 38.2%: 0.8768
Daily Fibonacci 61.8%: 0.8752
Daily Pivot Point S1: 0.8725
Daily Pivot Point S2: 0.869
Daily Pivot Point S3: 0.8655
Daily Pivot Point R1: 0.8795
Daily Pivot Point R2: 0.883
Daily Pivot Point R3: 0.8865