Back
1 Feb 2019
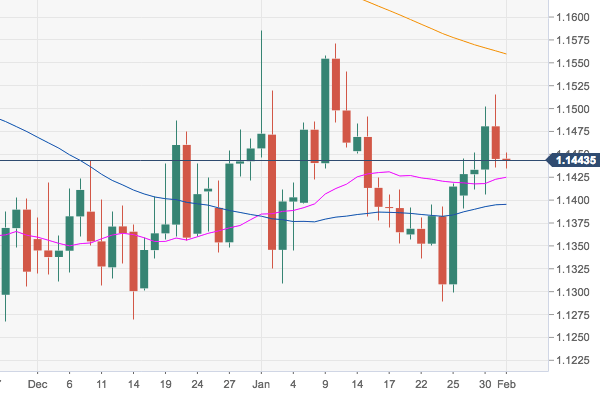
EUR/USD Technical Analysis: The 100-day SMA at 1.1440 holds the downside
- EUR/USD has sparked a correction lower after being once again rejected from levels beyond 1.1500 the figure on Thursday.
- The 1.1440 region, where sits the 100-day SMA is acting as interim support ahead of the 21-day SMA at 1.1423.
- In the broader picture, the neutral/bullish view on the pair remains in place as long as the 1.1290/85 band underpins.
EUR/USD daily chart
EUR/USD
Overview:
Today Last Price: 1.1446
Today Daily change: 0.0001 pips
Today Daily change %: 0.01%
Today Daily Open: 1.1445
Trends:
Daily SMA20: 1.1424
Daily SMA50: 1.1394
Daily SMA100: 1.1444
Daily SMA200: 1.1564
Levels:
Previous Daily High: 1.1516
Previous Daily Low: 1.1436
Previous Weekly High: 1.1418
Previous Weekly Low: 1.1289
Previous Monthly High: 1.1586
Previous Monthly Low: 1.1289
Daily Fibonacci 38.2%: 1.1466
Daily Fibonacci 61.8%: 1.1485
Daily Pivot Point S1: 1.1415
Daily Pivot Point S2: 1.1386
Daily Pivot Point S3: 1.1336
Daily Pivot Point R1: 1.1495
Daily Pivot Point R2: 1.1545
Daily Pivot Point R3: 1.1575