Back
17 Jan 2019
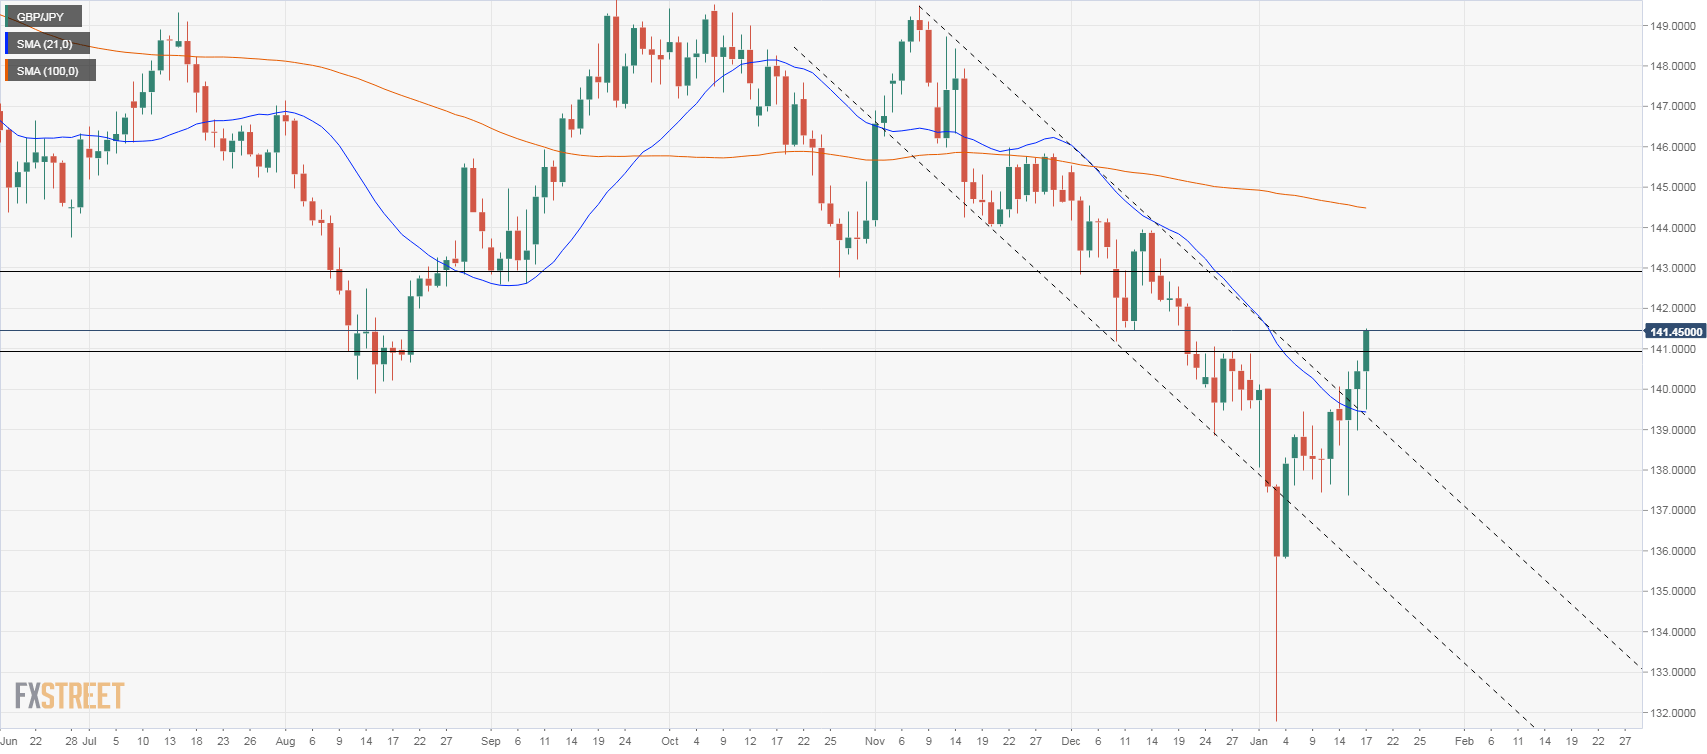
GBP/JPY Technical Analysis: Breaks 141.00 and points to further gains
- The pound is up for the third day in a row against the yen and broke above a critical resistance level. A consolidation on to of 141.00 would signal more gains ahead.
- The daily chart favors the upside as long as it holds above 141.00.
- The recent move to the upside sent price above the 20-day moving average and also on top of a short-term downtrend line.
- To the downside, a slide back under 139.50 would point to more weakness ahead.
GBP/JPY Daily Chart
GBP/JPY
Overview:
Today Last Price: 141.42
Today Daily change: 97 pips
Today Daily change %: 0.698%
Today Daily Open: 140.44
Trends:
Daily SMA20: 139.34
Daily SMA50: 142.47
Daily SMA100: 144.52
Daily SMA200: 145.65
Levels:
Previous Daily High: 140.71
Previous Daily Low: 138.99
Previous Weekly High: 139.49
Previous Weekly Low: 137.44
Previous Monthly High: 145.52
Previous Monthly Low: 138.86
Daily Fibonacci 38.2%: 140.05
Daily Fibonacci 61.8%: 139.65
Daily Pivot Point S1: 139.39
Daily Pivot Point S2: 138.33
Daily Pivot Point S3: 137.67
Daily Pivot Point R1: 141.11
Daily Pivot Point R2: 141.77
Daily Pivot Point R3: 142.83