Back
14 Aug 2018
NZD/USD Technical Analysis: buyers struggling to take 0.66
- The Kiwi is looking for a foothold after last week's steep decline on withering market sentiment.
- NZD bulls are hoping for a push higher, but the economic calendar is a thin showing for the Kiwi this week, with nothing on the docket until Thursday's PPI.
- Middling action for this week sees indicators leaning into their midranges as market participants freeze in their tracks.
NZD/USD Chart, 15-Minute
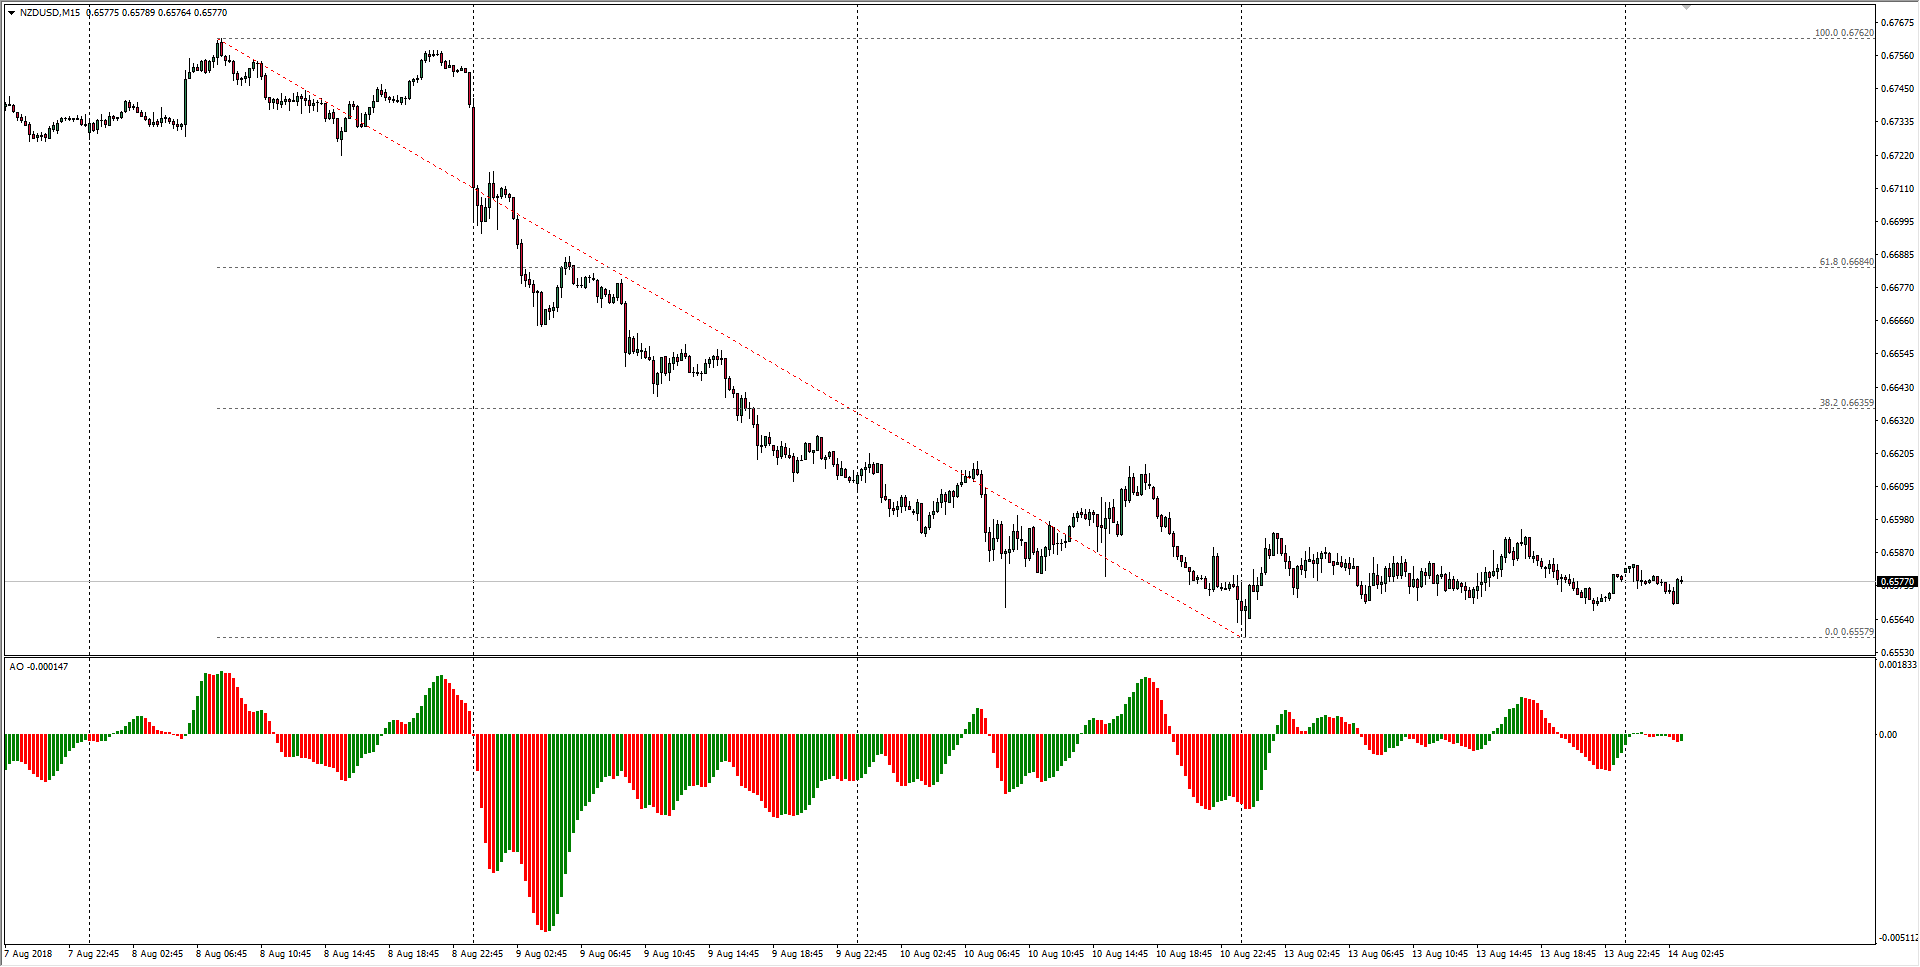
| Spot rate: | 0.6577 |
| Relative change: | Negligible |
| High: | 0.6582 |
| Low: | 0.6569 |
| Trend: | Sideways |
| Support 1: | 0.6569 (current day low) |
| Support 2: | 0.6557 (current week low) |
| Support 3: | 0.6529 (S3 daily pivot) |
| Resistance 1: | 0.6582 (current day high) |
| Resistance 2: | 0.6684 (61.8% Fibo retracement level) |
| Resistance 3: | 0.6762 (previous week high) |