EUR/USD Price Analysis: Not out of the woods yet, 100/200-day SMAs breakdown in play
- EUR/USD struggles to lure buyers and is undermined by a combination of factors.
- Reduced Fed rate cut bets continue to lend support to the USD and cap the upside.
- Political uncertainty in Europe is further holding back the Euro bulls on the defensive.
The EUR/USD pair edges higher during the Asian session on Tuesday and currently trades around the 1.0765-1.0770 area, albeit lacks strong follow-through buying. Moreover, the fundamental backdrop and the technical setup warrant some caution before positioning for an extension of the previous day's modest rebound from the 1.0735-1.0730 region, or a one-month low.
The US Dollar (USD) remains well supported by growing acceptance that the Federal Reserve (Fed) might keep interest rates higher for longer, bolstered by the stronger-than-expected US jobs data released on Friday. Adding to this, French President Emmanuel Macron's decision to call snap elections later this month increased political uncertainty in the Eurozone's second-biggest economy, which might continue to undermine the shared currency. This, in turn, favors bearish traders and validates the near-term negative outlook for the EUR/USD pair.
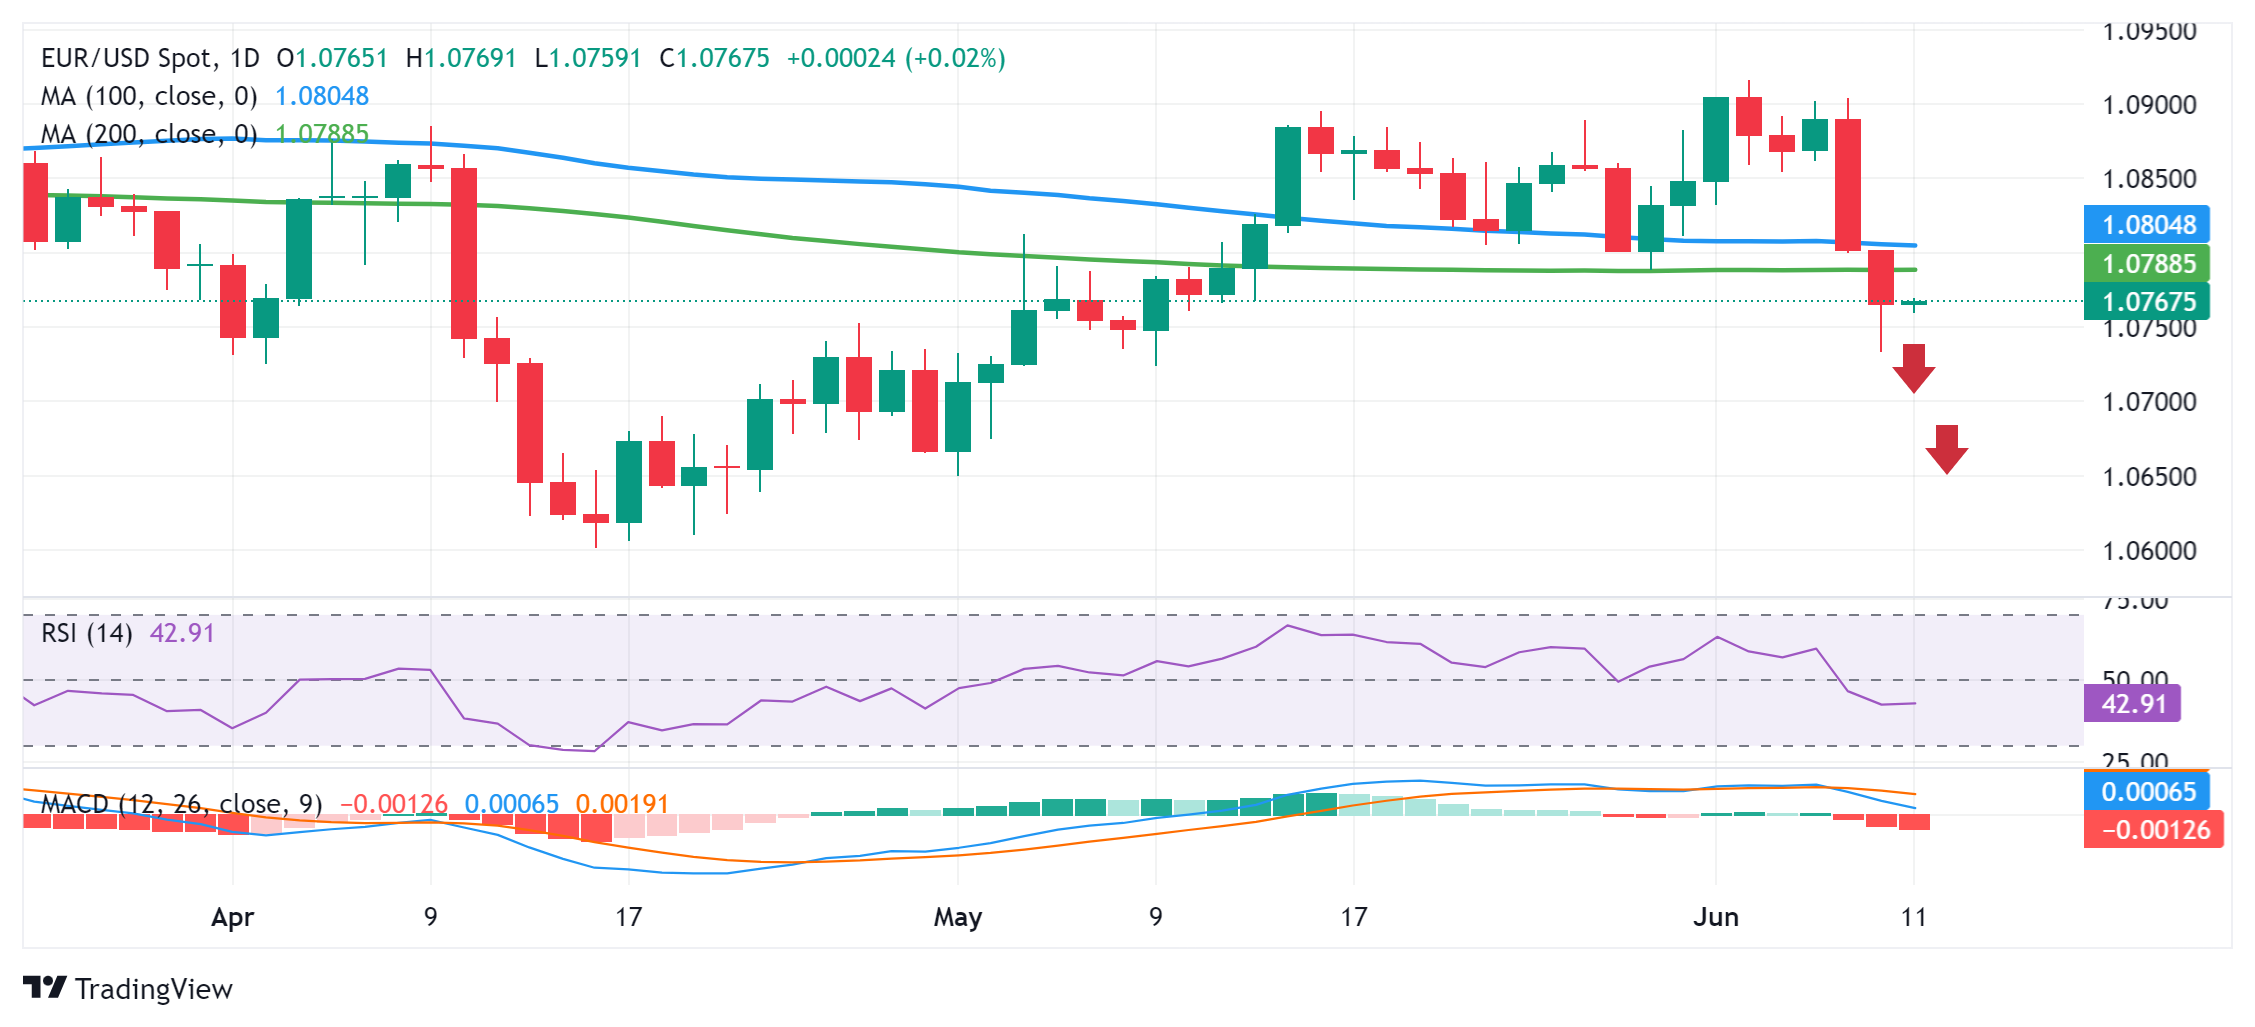
From a technical perspective, the post-NFP fall below the 100-day Simple Moving Average (SMA) near the 1.0800 mark and a subsequent breakdown through the 200-day SMA adds credence to the negative outlook amid bearish oscillators on the daily chart. Hence, any further move up might still be seen as a selling opportunity and runs the risk of fizzling out rather quickly near the 1.0800 round figure. The said handle should act as a pivotal point, which if cleared decisively might prompt a short-covering rally towards the 1.0865-1.0870 supply zone en route to the 1.0900 mark.
On the flip side, the overnight swing low, around the 1.0735-1.0730 area now seems to protect the immediate downside ahead of the 1.0700 round figure. Some follow-through selling will be seen as a fresh trigger for bearish traders and drag the EUR/USD pair to the next relevant support near the 1.0650-1.0640 region. Spot prices could eventually slide towards testing the 1.0600 mark, or the YTD low touched in April.
EUR/USD daily chart