GBP/USD Price Analysis: Climbs further beyond 1.2100, eyes 50-day SMA amid softer USD
- GBP/USD turns positive for the second successive day and climbs back above the 1.2100 mark.
- A positive risk tone undermines the USD and lends some support amid the latest Brexit optimism.
- Bulls might still wait for a sustained strength beyond the 50-day SMA before placing fresh bets.
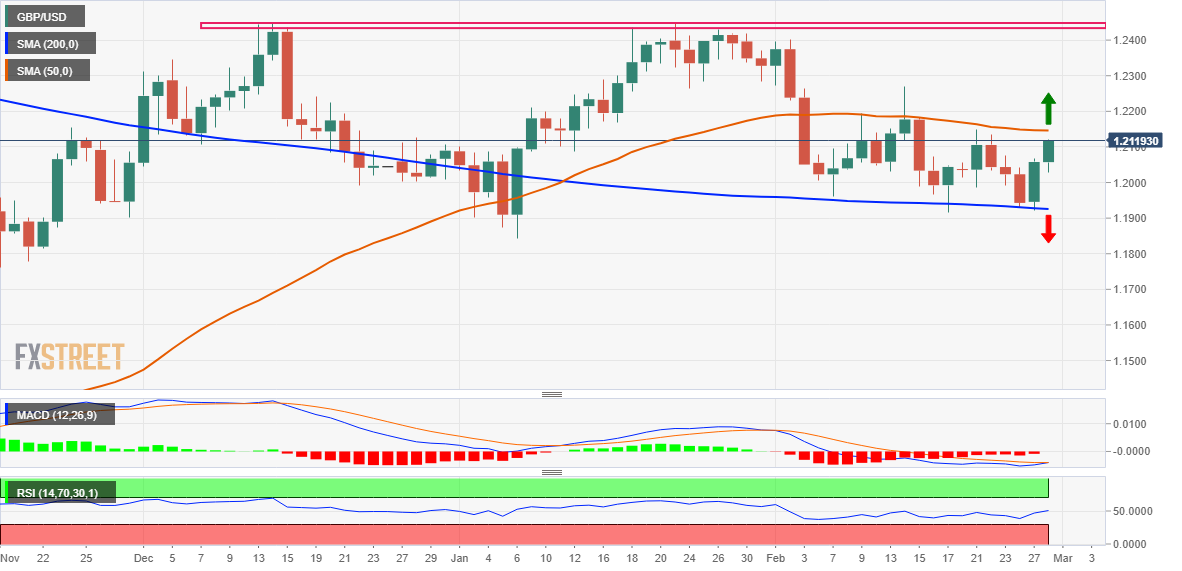
The GBP/USD pair catches fresh bids following an early slide to the 1.2025 area on Tuesday and builds on the previous day's solid bounce from the very important 200-day Simple Moving Average (SMA). The momentum pushes spot prices to a four-day high, beyond the 1.2100 mark, during the early North American session and is sponsored by a combination of factors.
The latest optimism over a new deal on the Northern Ireland protocol between the UK and EU, along with rising bets for additional rate hikes by the Bank of England (BoE), underpin the British Pound. Adding to this, a generally positive tone around the equity markets weighs on the safe-haven US Dollar and lends some support to the GBP/USD pair. That said, the prospects for further policy tightening by the Fed should act as a tailwind for the Greenback and cap the major amid looming recession risks.
Moreover, neutral oscillators on the daily chart warrant some caution for aggressive bullish traders and before positioning for a further appreciating move for the GBP/USD pair. Hence, any subsequent move up is more likely to confront stiff resistance and remain capped near the 50-day SMA, currently around the 1.2145 region. Some follow-through buying, however, could trigger a short-covering rally and lift spot prices beyond the 1.2200 mark, towards the recent swing high, around the 1.2265-1.2270 zone.
On the flip side, the 1.2065-1.2060 area now seems to act as immediate support ahead of the 1.2025 zone (the daily low) and the 1.2000 psychological mark. Any further decline might continue to attract some buyers and remain limited near the 200-day SMA, currently pegged near the 1.1925-1.1920 region. A convincing break below the latter will complete a bearish double-top pattern formed near the 1.2445 area and drag the GBP/USD pair to the YTD low, around the 1.1840 zone touched in January.
GBP/USD daily chart
Key levels to watch