GBP/USD Price Analysis: Establishment above 1.2000 is a prerequisite for further upside
- Upbeat market sentiment has strengthened the Pound Sterling.
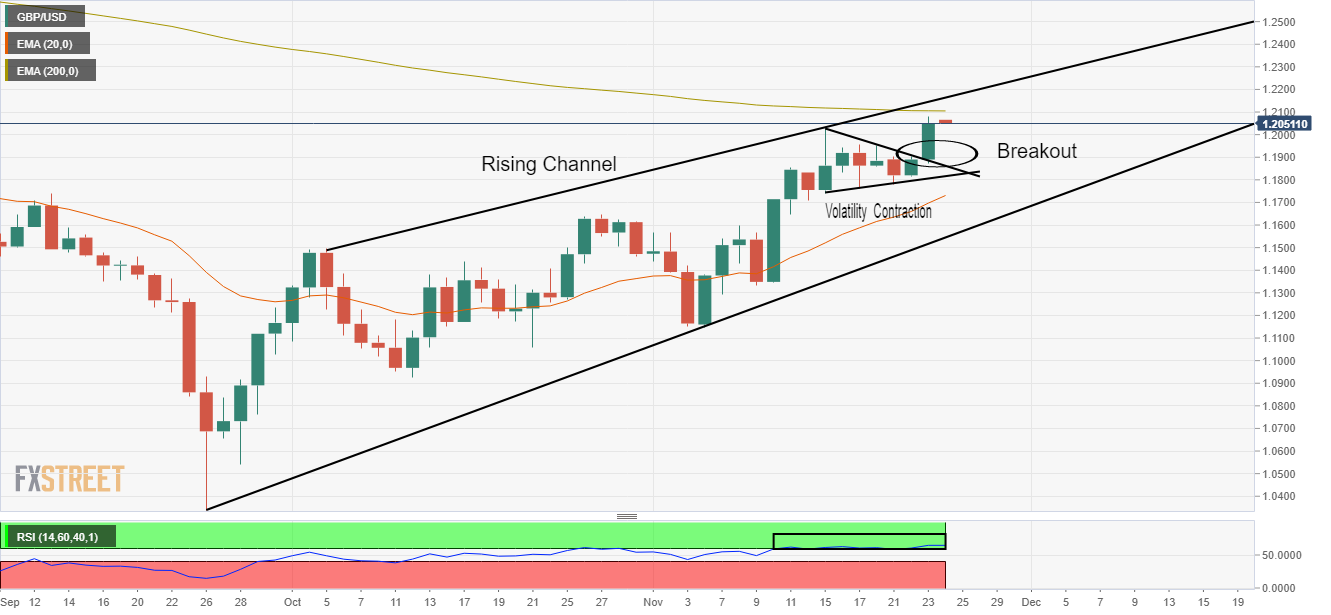
- A breakout of a VCP results in wider ticks formation and heavy volume.
- The formation of a Rising Channel indicates that the broader trend is towards the north.
The GBP/USD pair is displaying a sideways performance in the early Tokyo session after a juggernaut rally to near 1.2080. The Cable witnessed an immense buying interest after sustaining above the round-level resistance of 1.1900. A significant improvement in investors’ risk appetite strengthened the Pound Sterling.
Meanwhile, the US dollar index (DXY) has dropped 106.00 despite a firmer jump in the US Durable Goods Order data. It seems that less-hawkish cues on interest rate guidance from the Federal Open Market Committee (Fed) minutes have impacted the US Dollar.
On a daily scale, the Cable has delivered a breakout of a Volatility Contraction Pattern (VCP) that results in the formation of wider ticks and heavy volume. Broadly, a Rising Channel formation satisfies the condition of a long-term upside trend. Also, advancing the 20-period Exponential Moving Average (EMA) at 1.1738 adds to the upside filters.
Adding to that, the Relative Strength Index (RSI) (14) has shifted into the bullish range of 60.00-80.00, which indicates that the upside momentum is active.
Going forward, the mighty 200-period EMA at 1.2110 could be a hurdle for the Pound Sterling bulls.
For further upside, the asset is required to establish firmly above the psychological resistance of 1.2000. But for a run-up, the Cable is needed to overstep the 200-EMA at 1.2110 firmly, which will drive GBP/USD towards the round-level resistance of 1.2200, followed by August 2 high at 1.2280.
On the flip side, a drop below Monday’s low at 1.1780 will drag the asset toward November 14 low at 1.1710. A slippage below November 14 low will expose the asset to the horizontal support plotted from October 27 high at 1.1646.
GBP/USD daily chart